Home Advantage vs Team Quality: Advanced Football Betting Guide
2025-26 Season Guide

Home Advantage vs Team Quality: Advanced Football Betting Guide

Jump to section

The Home Advantage Puzzle in Football Betting

"Always back the home team." You'll hear this from casual punters everywhere, and the numbers seem to back them up. Home teams win roughly half the matches across major European leagues. During the 2024/25 Premier League season, home sides claimed 43% of victories compared to just 28-30% for away teams.

But that home record might be misleading.

When a team looks dominant at home, you're seeing either genuine quality or the temporary boost of stadium advantage, travel fatigue, and referee bias. The difference affects your bottom line. COVID-19's "ghost games" gave us an unprecedented look at what happens when you strip away the crowd factor, and the results changed how sharp bettors approach venue analysis.

This guide shows you how to separate real team quality from stadium inflation using expected goals (xG) and other advanced metrics. We'll cover what the ghost games revealed, statistical methods that strip away venue effects, and practical betting strategies that exploit market inefficiencies.

What Is Home Advantage in Football Betting?

Home advantage isn't one thing—it's several factors working together. Understanding what's actually driving that home win percentage is the first step toward betting on it intelligently.

The four main components:

  1. Crowd Support (35-40% of effect) – Thousands of supporters change how matches play out. Referees award more fouls and cards against away teams in hostile atmospheres. Players feed off energy—or wither under it.

  2. Travel Fatigue (15-20% of effect) – Away deals with disrupted routines, unfamiliar hotels, and physical exhaustion from travel.

  3. Pitch Familiarity (15-20% of effect) – Knowing exactly how the ball rolls on your home pitch, the bounce off your own boards, the sightlines from different angles—these small edges add up.

  4. Tactical Approach (20-25% of effect) – Home teams typically play attacking football. Away sides sit deep and counter.

Here's what matters: at least one-third of traditional home advantage depends entirely on the crowd. Remove the supporters, and you lose a significant chunk of that home boost.

Infographic showing four components of home advantage in football: crowd support, travel fatigue, pitch familiarity, and tactical approach
The four main components of home advantage, with crowd support accounting for 35-40% of the effect

Data Analyst

In COVID era, football matches have been played in empty stadiums and unusual conditions. One hypothesis is that COVID may have questioned the way the game is played and especially the advantage of playing at home (e.g., due to the absence of fans).

Mathieu Acher

COVID Ghost Games: What Changed Stadium Advantage?

The 2020-2021 season gave us something football analytics had been waiting for: a massive natural experiment. With COVID forcing matches behind closed doors, researchers finally saw what happened when you removed the crowd element.

The results changed how serious bettors think about venue advantage.

Premier League: Home advantage vanished. During the ghost games period, away teams earned more points than home teams—a complete reversal of historical patterns.

Ligue 1: Same story. Home advantage evaporated in empty stadiums.

La Liga: Maintained some advantage but saw significant reduction from pre-COVID levels.

Bundesliga: Recorded substantial drops in home win rates.

A systematic review covering 18,600+ matches confirmed the pattern: removing crowds reduces home advantage by 30-50%.

This quantifies exactly how much traditional home performance depends on the stadium rather than the squad. When you see a team with an excellent home record but mediocre away form, you now have a framework for predicting what happens when circumstances change.

Academic Research (2021)

Our findings—based on 26 primary studies—indicate that ghost games have a considerable impact on the phenomenon of home advantage.

PMC Systematic Literature Review

Implications of Ghost Game Research

This systematic review provides robust evidence for what many analysts suspected: home advantage isn't a fixed property of the game, but significantly depends on crowd presence. The implications for betting strategies are significant—traditional home advantage assumptions need to be recalibrated when crowds are absent or reduced.

Comparison illustration showing packed stadium versus empty COVID ghost games, demonstrating crowd impact on home advantage
COVID ghost games revealed that removing crowds reduces home advantage by 30-50%, changing how serious bettors analyze venue effects

xG by Venue: The Key to Advanced Football Analysis

Expected Goals (xG) is the sharpest tool we have for separating team quality from stadium advantage. Unlike raw goals scored, xG measures the quality of chances created—accounting for shot location, defensive pressure, shot type, and other factors.

When you break down xG performance at home versus away, patterns emerge that goal statistics completely miss.

Premier League xG Home/Away Disparities (2023/24)

Team Home xG Away xG Difference
Liverpool 55.78 33.58 +22.20
Newcastle 47.08 30.17 +16.91
Chelsea 44.71 30.55 +14.16
Aston Villa 39.71 25.01 +14.61
Arsenal 44.47 32.95 +11.52
Tottenham 39.77 29.18 +10.59
Manchester City 41.47 40.46 +1.01
Bournemouth 27.86 28.83 -0.97
Premier League xG Home/Away Disparities (2023/24) - Liverpool shows the largest venue dependence, while Manchester City demonstrates consistent performance across stadiums.

These numbers tell stories raw goals don't

Liverpool's +22.20 xG differential between home and away is the largest in the league. Their performance shifts dramatically based on venue—dangerous at Anfield, markedly less threatening on the road. This affects how you bet them. Their home matches might offer better value than away fixtures where the market could overprice them based on reputation.

Manchester City tells the opposite story. Their +1.01 xG difference is the smallest in the league. Pep Guardiola's tactical system creates consistent quality wherever they play. That consistency makes them ideal for certain betting strategies—their performance doesn't depend on where the match happens.

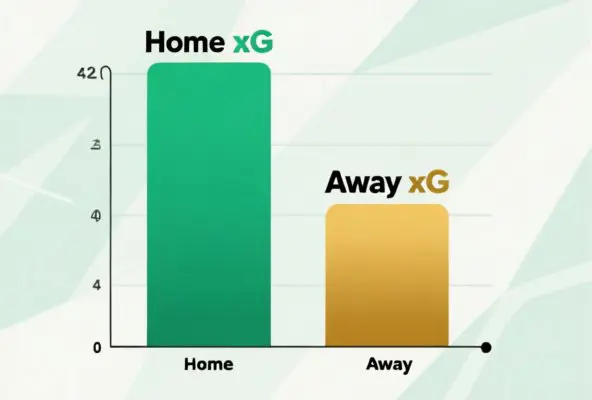
Stylized bar chart comparing expected goals performance at home versus away, showing venue-dependent performance
Liverpool shows dramatic xG differences between home and away, while Manchester City demonstrates consistent performance across venues

2024 Season Report

Man City have been among most consistent for goal threat regardless of match location in 2023/24. They placed fifth for xG in home contests, with a score of 41.47, near identical to their 40.46 in away encounters.

Premier League Analysis

How to Separate Team Quality from Stadium Advantage

Here are practical statistical methods you can apply to your betting analysis.

Method 1: xG-Adjusted Team Ratings

Calculate separate strength ratings for home and away performance:

xG-Adjusted Team Rating Formulas
HomeAttackStrength = AvgHomeGoalsScored / AvgLeagueHomeGoalsScored
HomeDefenceStrength = AvgHomeGoalsConceded / AvgLeagueHomeGoalsConceded
AwayAttackStrength = AvgAwayGoalsScoreed / AvgLeagueAwayGoalsScored
AwayDefenceStrength = AvgAwayGoalsConceded / AvgLeagueAwayGoalsConceded

Adjusting for Home Advantage Effect

This accounts for the ~30% of home advantage that persists even without crowds (travel, pitch familiarity, tactical approach). It strips away crowd-dependent inflation to reveal underlying team quality.

Method 2: Points Per Game (PPG) Differential Analysis

Calculate PPG separately for home and away matches, then determine true quality:

Home Advantage Adjustment Formula
AdjustedHomeStrength = HomeStrength - (LeagueHomeAdvantage × 0.3)
AdjustedAwayStrength = AwayStrength + (LeagueHomeAdvantage × 0.3)
True Quality PPG Formula
Overall PPG - (HomePPG - AwayPPG) × adjustment factor

PPG Differential Analysis Example

Example from Premier League 2024/25:

  • Arsenal: 2.46 home PPG, 2.00 away PPG (0.46 gap)
  • Sunderland: 2.17 home PPG, 0.77 away PPG (1.40 gap)

Arsenal's minimal venue dependence indicates genuine quality. Sunderland's massive gap suggests stadium-inflated performance that may not travel. Both are useful insights, but they lead to different betting decisions.

Method 3: Rolling Window Analysis

Form isn't static—it shifts. Use Exponential Moving Average (EMA) to weight recent matches more heavily:

  • Short-term window (5-10 matches): Reacts quickly to current form, useful for in-season betting
  • Medium-term window (15-20 matches): Balances recency with statistical significance
  • Long-term window (30+ matches): Reveals underlying team quality, less affected by variance

Track home and away performance separately across these windows. You'll spot whether venue dependence is increasing, decreasing, or stable—information the market often fails to price correctly.

Advanced Football Betting Strategies Using Home/Away Analysis

With these analytical tools, here are specific strategies that exploit market inefficiencies.

Strategy 1: The Manchester City Model – Venue-Consistent Teams

Teams with minimal home/away xG difference represent genuine quality and offer more reliable betting strategies.

Identify teams with:

  • Home/away xG difference < 5%
  • Strong away xG (>1.5 per game)
  • Consistent performance across venues

Why this works: When results aren't inflated by stadium advantage, performance becomes more predictable. Manchester City exemplifies this—the results hold up regardless of venue.

Strategy illustration showing value betting opportunity when teams perform differently at home versus away
Betting against teams with inflated home records and poor away performance represents a proven value strategy

2024 Season Report

Essentially, data shows that Pep Guardiola's tactics make Haaland every bit as threatening on his travels as he is when playing at Etihad Stadium.

Premier League xG Analysis

Strategy 2: Crowd Advantage Adjustment

For matches with restricted attendance or reduced crowd capacity, calculate the adjusted home advantage effect.

Crowd Advantage Adjustment Formula
ExpectedHomeAdvantage = HistoricalHA × (CrowdCapacity / MaxCapacity)

# Examples:
# Full capacity: 100% of historical home advantage
# 75% capacity: ~85% of historical
# 50% capacity: ~60% of historical

Betting Application: Crowd Advantage

Betting application: Reduce home win probability by 5-15% when:

  • Crowd restrictions apply
  • Late-season matches with reduced attendance
  • Midweek cup matches with lower crowds

The COVID data proved reduced crowds meaningfully reduce home advantage. Markets often fail to price this in.

Strategy 3: Home/Away Discrepancy Value Bets

Identify situations where the market overweights home performance:

Look for:

  1. Team with excellent home record (>2.2 PPG at home)
  2. Same team has poor away record (<1.2 PPG away)
  3. Market prices them as a consistently strong team
  4. True quality: Average of home + away PPG

Example Calculation:

Home/Away Discrepancy Value Calculation
# Example: Stadium-Inflated Team Analysis
Team A: 2.6 home PPG, 1.1 away PPG
Market treats them as: 2.6 PPG team
Adjusted quality: (2.6 + 1.1) / 2 = 1.85 PPG
Value: Bet AGAINST when odds reflect 2.6 PPG performance

Home/Away Discrepancy Value Strategy

This exploits the market's tendency to treat recent strong home form as indicative of overall quality, when away form reveals a weaker underlying team.

Strategy 4: Promoted Team Away Performance

Historically profitable across multiple seasons:

  • Betting against promoted teams in away games
  • Especially effective in August-December
  • First-season away disadvantage is real and persistent
  • Returns: ~2.45% ROI based on historical data

Promoted teams struggle away due to travel, hostile environments, and tactical naivety. The market adjusts slowly, creating value in the first half of the season.

Strategy 5: xG Performance Regression

Identify teams with significant xG vs goals discrepancy:

Look for:

  • High xG but low actual goals scored (underperforming)
  • Focus: Away matches where underperformance compounds
  • These teams are due for goal regression to the mean

Example Calculation:

xG Regression Example Calculation
# Example: xG Regression Opportunity
Team Away xG: 1.8 per game
Team Actual Goals: 1.2 per game away
Discrepancy: 0.6 goals per game underperforming
Bet: OVER goals when regression appears imminent

BBC Sport (2025)

If you leave a game saying 'I can't believe we lost that' then you will most likely have a higher xG than your goal return. If you're saying 'I can't believe we won that', then it's going to be a low xG.

Dale Johnson

Common Mistakes in Football Betting: Home/Away Analysis

Teams creating quality chances but not converting will eventually see results normalize. Betting on the correction is a proven xG-based strategy.


Even with sophisticated analytics, bettors fall into predictable traps. Here's what to avoid.

1. Overweighting Small Samples

Problem: Making decisions from 3-5 game home/away samples
Reality: Need 15+ games for statistical significance
Solution: Use weighted averages with larger samples and preseason expectations

A team that wins four straight home matches hasn't suddenly become world-class at home. They've experienced positive variance. Meaningful patterns need larger samples.

2. Ignoring Schedule Effects

Problem: "Strong home record" built against weak opposition
Reality: Schedule strength varies significantly
Solution: Adjust home/away PPG for opponent quality

If a team's excellent home record came against bottom-half opposition, it tells us less than if it came against top teams. Always consider strength of schedule.

3. Assuming Static Home Advantage

Problem: Treating all home advantage equally across teams
Reality: Varies by team, crowd size, match importance
Solution: Team-specific and situation-specific adjustments

Liverpool at Anfield with a full house represents different home advantage than a mid-table team with half-full stadium.

4. Neglecting Tactical Changes

Problem: New manager changes approach but analysis uses old data
Reality: Coaching significantly affects venue performance
Solution: Weight recent data more heavily after managerial changes

A defensive-minded new manager might reduce home attacking output while improving away defensive solidity. Historical data becomes less relevant.

5. Cherry-Picking Data

Problem: Selecting specific splits that confirm bias
Reality: Need comprehensive data review
Solution: Predefine analysis criteria before examining data

It's tempting to focus on data supporting your intended bet. Genuine insight comes from examining all relevant data, not just the convenient portions.

6. Ignoring Regression to Mean

Problem: Expecting extreme splits to continue indefinitely
Reality: Performance normalizes over time
Solution: Use moving averages and account for variance

Extreme performance in either direction typically moderates. Teams with dramatic home/away splits tend to see gaps narrow.

7. Forgetting Context

Problem: Treating all home/away games equally
Reality: Cup competitions, derbies, relegation battles differ
Solution: Separate analyses by match importance and type

A local derby may reduce the away team's disadvantage. A relegation six-pointer at home amplifies pressure. Context matters more than venue.


League-Specific Home Advantage Patterns

Home advantage isn't uniform across European football. Each league exhibits unique patterns that savvy bettors can exploit.

Premier League Home Advantage

Current state: Home advantage has partially recovered post-COVID but remains 10-15% below pre-2020 levels.

Notable pattern: Home table leaders differ significantly from away table leaders, suggesting venue-dependent performance for many clubs.

Betting implication: Adjust historical home advantage expectations downward; focus on teams with consistent xG home and away (Arsenal, Manchester City).

Current state: Persistent pattern of elevated away win rates compared to historical norms.

Notable anomaly: Matchday 24 of 2024-25 season saw 8 of 9 matches won by away teams—virtually unprecedented in European football.

Betting implication: Value on away teams, especially when favorites at home. Bundesliga may be experiencing structural reduction in home advantage.

La Liga Stadium Advantage

Current state: Most stable home advantage among major leagues, maintaining closer to historical norms.

Notable pattern: Even during COVID period, La Liga maintained home advantage better than other top leagues.

Betting implication: Traditional home advantage strategies remain more viable in La Liga than elsewhere.

Serie A Home/Away Form

Current state: Moderate reduction in home advantage post-COVID, but less dramatic than Premier League or Bundesliga.

Betting implication: Mixed strategies—some home advantage remains, but less than historical data suggests.

Ligue 1 Stadium Effects

Current state: Home advantage disappeared almost entirely during ghost games and has only partially recovered.

Betting implication: Consider reduced home advantage in pricing decisions; away teams may offer value.

The Future of Home Advantage Analysis in Football Betting

Several trends are reshaping how we think about and analyze home advantage.

xG Adoption Accelerating

Mainstream media now regularly cites xG in match coverage. Betting markets are becoming increasingly xG-aware, reducing the edge available from simple xG-based analysis.

Implication: Pure goals-based models are losing effectiveness. The future belongs to sophisticated xG-adjusted analysis that accounts for venue, opponent quality, and tactical context.

Post-COVID Home Advantage Recovery

Two seasons post-pandemic, home advantage has not fully returned to pre-COVID levels across most leagues. Whether this represents a permanent shift or ongoing adjustment remains unclear.

Implication: Reduce historical home advantage assumptions by 10-15% until data confirms full recovery.

Tactical Evolution in Football

Modern tactics are increasingly flexible, with teams like Manchester City showing minimal venue dependence. Whether this represents a broader trend toward venue-agnostic football remains to be seen.

Implication: Monitor for increasing numbers of teams with consistent home/away xG profiles. These teams represent more reliable betting opportunities.

League-Specific Divergence

Evidence suggests one-size-fits-all home advantage models are failing. Bundesliga's elevated away wins contrast with La Liga's stable patterns, indicating league-specific factors at play.

Implication: Develop league-specific home advantage adjustments rather than applying universal modifiers.

Advanced Metrics Accessibility

xG, xGA, and xPoints are now widely available through free sources (Understat, FBref). This democratization of advanced metrics is closing the gap between professional and retail bettors.

Implication: Edge now requires deeper analysis—combining multiple advanced metrics, accounting for tactical changes, and identifying patterns before the market fully prices them in.

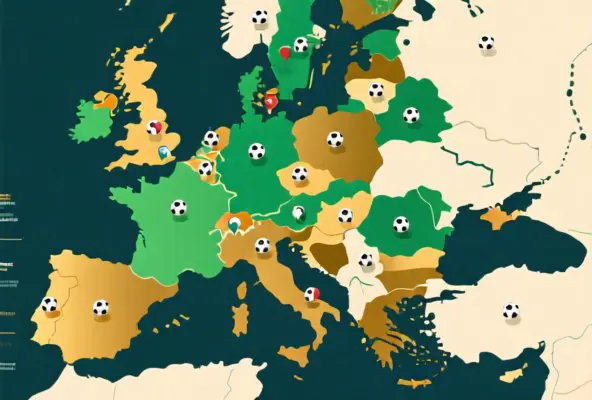
Stylized European league map showing different home advantage patterns across football competitions
European leagues show different home advantage patterns, with La Liga maintaining traditional advantage while Bundesliga sees elevated away win rates

Building Your Football Betting Analysis Toolkit

Ready to implement these concepts? Here's your practical toolkit for separating team quality from stadium advantage.

Essential Metrics for Football Betting

  1. xG (Expected Goals) - Primary quality measure, separates performance from finishing luck
  2. xGA (Expected Goals Against) - Defensive quality metric, accounts for chance quality conceded
  3. xPoints - Expected points based on xG/xGA, more stable than actual points
  4. Home/Away PPG - Raw performance by venue, adjusted for schedule strength
  5. Big Chances Created/Conceded - Separates by venue for deeper insight

Secondary Indicators for Away Form Analysis

  • Shots on Target Differential by venue
  • Set Piece Success (corners/free kicks home vs away)
  • Travel Distance for away matches
  • Rest Days between matches (affects away performance more)

Football Betting Data Sources

  • Premier League Official - Primary xG data
  • Understat - Free xG metrics for top leagues
  • FBref - Comprehensive advanced statistics
  • SoccerSTATS - Home/away tables by league

Home/Away Form Analysis Checklist

Before placing any bet involving home/away form:

  • Check xG home/away differential for both teams
  • Calculate adjusted strength ratings removing crowd advantage
  • Verify sample size (15+ games preferred)
  • Adjust for schedule strength
  • Check for recent managerial or tactical changes
  • Consider league-specific home advantage trends
  • Account for context (derby, relegation battle, cup competition)

Continuous Improvement in [Sports Betting](/article/bankroll-management-in-betting-the-complete-guide-to-protecting-your-funds)

The market for home/away advantage analysis is constantly evolving. What worked five years ago may not work today. Commit to:

  1. Regularly reviewing your home/away analysis results
  2. Updating methods as new research emerges
  3. Tracking which leagues show changing patterns
  4. Testing new metrics and strategies with small stakes
  5. Learning from both successes and failures

Conclusion: Quality Over Venue in Football Betting

Home teams win roughly half the time. That statistic has held for decades. But for analytical bettors, the real insight is understanding why and when that advantage manifests.

COVID ghost games proved that 30-50% of traditional home advantage depends on crowd support. Strip that factor away, and you see which teams rely on stadium atmosphere and which possess genuine quality that travels.

Manchester City's near-identical home and away xG numbers reveal a team whose performance isn't venue-dependent. Liverpool's dramatic +22.20 xG home/away split shows a team that feeds off Anfield's atmosphere. Both observations are valuable—one for consistency, one for understanding when to fade market overpricing.

The tools for separating quality from venue are widely available: xG metrics by venue, rolling window analysis, points per game differentials, adjusted strength ratings. Combine these with awareness of league-specific patterns, schedule effects, and tactical changes, and you have a framework for football betting that transcends simple "back the home team" thinking.

As analytics evolve and markets become more efficient, the edge belongs to bettors who dig deeper than surface-level statistics. Understanding the true nature of home advantage—and how to separate it from genuine team quality—is one area where sophisticated analysis continues to find value.

The next time you see a team with an impressive home record, ask yourself: Is this quality, or is this Anfield? Is this a good team, or just a comfortable one? The answer might transform your betting results.


Data sources: Premier League official statistics, SoccerSTATS.com, FBref.com, academic studies on COVID ghost games (2020-2025), and systematic literature reviews on home advantage phenomena. All statistics current through February 2026.

Professional headshot of Caleb Harrington, Senior Football & Betting Analyst

Caleb Harrington

Senior Football & Betting Analyst

Caleb Harrington is an experienced sports analyst and writer with over 8 years of expertise in football betting markets and tennis predictions. A graduate of Sports Journalism, Caleb combines deep statistical knowledge with an engaging writing style to make complex betting concepts accessible to all readers. He's particularly known for his data-driven approach to Premier League analysis and his insightful coverage of major tennis tournaments. When he's not analyzing odds or writing match previews, Caleb enjoys exploring emerging trends in sports betting technology and strategy.