Hot Hand Fallacy

The Hot Hand: Myth or Real? What the Science Says About Streaks in Sport

He's scored in four straight, so he's a cert for a fifth. Or is he? Forty years of research says the hot hand is real, it's small, and punters pay far too much for it.

The Hot Hand: Myth or Real? What the Science Says About Streaks in Sport
On this page

The striker who can't stop scoring

You know the feeling. Your striker has scored in four games running, his anytime price is sitting there on the coupon, and your gut is telling you he's on fire. Back him. He can't miss at the moment.

That gut feeling has a name: the hot hand. It's the belief that a player on a run of success is more likely to keep succeeding than his normal ability would suggest. It started on basketball courts, where a shooter who's sunk a few in a row is said to be "heating up", but you'll find it all over sport, right down to the goalscorer markets at three o'clock on a Saturday.

For decades, psychologists insisted the hot hand fallacy was an illusion. Then two economists spotted a flaw in the maths and turned the whole thing on its head. So here's our verdict before we go any further: the hot hand is real, it's small, and punters massively overprice it.

The story runs from a famous paper that called it a myth, through a coin-flip trap nobody noticed for thirty years, to modern tracking data. And by the end you'll know exactly how to use it in the goalscorer and match odds markets.

How a 1985 paper declared the hot hand a myth

In 1985 Thomas Gilovich, Robert Vallone and Amos Tversky published "The Hot Hand in Basketball", which went on to become one of the best-known papers in behavioural science. The test was simple. If the hot hand exists, a player should be more likely to make a shot when he made the one before.

They built the case in four steps, peeling away outside factors as they went:

  • The fans. A questionnaire of 100 basketball fans at Cornell and Stanford, to pin down what people actually believed about streaks.
  • The games. Individual shot records from the 1980-81 Philadelphia 76ers.
  • The free throws. Free-throw data, where every shot is the same and no defender gets in the way.
  • The lab. A controlled shooting experiment with no opponent and nothing riding on it.

The verdict was blunt. Successive shots looked independent, and feeling "hot" predicted nothing. Belief in the hot hand, they concluded, was a cognitive illusion.

Their explanation was a persuasive one. People don't have a natural feel for randomness. We expect even a short run of coin tosses to come out roughly half heads and half tails, so when a genuinely random sequence throws up a cluster, we decide it can't be chance. That same misreading drives both the hot hand (the streak will continue) and its mirror image, the gambler's fallacy (the streak is due to end). Our guide to why "due for a win" is a dangerous myth takes that second trap apart.

The "hot hand fallacy" went straight into the textbooks, and for the next thirty years the argument looked settled.

1980s Philadelphia 76ers player at the free-throw line shooting, seen from behind in a packed arena
The 1980-81 76ers: the shot records that launched the hot hand debate.

The coin-flip trap that flipped the verdict

In 2018 Joshua Miller and Adam Sanjurjo published a paper in Econometrica with a gloriously cheeky title: "Surprised by the Hot Hand Fallacy? A Truth in the Law of Small Numbers." They'd found a subtle bias buried inside the very statistic the 1985 study leaned on.

The trap works like this. Take a short sequence of shots and look only at the ones that come straight after a hit. A perfectly random shooter will appear to do worse after hits than his true average. Sounds impossible, so let's prove it with a fair coin. Take every possible sequence of three flips, look at each flip that follows a head, and work out what share of those came up heads:

Fair coin, three flips: how often does a head follow a head?
Sequence   Flips that follow a head   Share that are heads
HHH        H, H                        1.00
HHT        H, T                        0.50
HTH        T                           0.00
HTT        T                           0.00
THH        H                           1.00
THT        T                           0.00
TTH        (none)                      not counted
TTT        (none)                      not counted

Average across the six counted sequences = 2.5 / 6 = 41.7%

A coin with no memory at all "follows a head with a head" only 41.7% of the time on this measure. In a short sequence, a streak uses up the heads, so whatever comes next leans slightly towards tails. Run the same enumeration on longer sequences and the bias shrinks, but slowly:

Flips in the sequence Average heads rate after a head
3 41.7%
4 40.5%
5 40.8%
8 43.3%
10 44.5%
16 46.7%
The true probability is 50% every time. The gap is pure measurement bias, and it only closes as the sequences get long.

Now take that back to the basketball court. The 1985 study found players made shots at much the same rate after hits as after misses, and called it "no hot hand". But a random shooter should look worse after a run of hits. Finding no difference is, in effect, evidence that players do get hot. Miller and Sanjurjo showed that correcting for the bias reverses the canonical study's conclusions, and they found significant evidence of streak shooting in the 1985 paper's own controlled shooting experiment with Cornell's college players.

“I've been in a thousand arguments over this topic, won them all, but convinced no one.”

— Amos Tversky, psychologist and co-author of the 1985 hot hand study

Is the hot hand real? What the modern data says

With the measurement problem out in the open, the picture changed fast. The research now points one way: the hot hand exists, but it's modest, patchy and very easy to overstate.

Basketball: 83,000 shots under the microscope

Bocskocsky, Ezekowitz and Stein, presenting at the MIT Sloan Sports Analytics Conference, used optical tracking data on more than 83,000 shots from the 2012-13 NBA season. They picked up something the old studies had no way of seeing. Players who were outperforming started taking harder shots: from further out, against tighter defence, and more often taking their team's next shot themselves.

That matters, because harder shots drag a hot player's raw hit rate back down and mask the effect. Once they adjusted for shot difficulty, they put the hot hand at 1.2 to 2.4 percentage points of extra chance to make the next shot. Real, measurable and small. In 2018 a UC Berkeley team (Daks, Desai and Goldberg) went back to 2016-17 Golden State Warriors shot data for Stephen Curry, Klay Thompson and Kevin Durant, building directly on the Miller-Sanjurjo correction.

Baseball: hot in every category

Green and Zwiebel took the question to Major League Baseball, publishing in Management Science, and found strong evidence of a hot hand in all ten statistical categories they tested. Being hot was worth between half and a full standard deviation of the spread in player abilities. For a spell, a decent player genuinely performs like a noticeably better one.

Their explanation for why basketball finds so little is a neat one. Defences can shift resources onto the hot shooter and even things out, whereas baseball gives teams far less room to do that. Then comes our favourite finding of the lot: teams responded to hot opponents about right, except they overreacted to the last five attempts. The believers and the sceptics were both partly right.

The wider research ends up in the same place. Only a subset of players show a hot hand, the effect tends to be small, and it may be strongest in repeated, identical tasks such as free throws and three-point contests rather than ordinary shots in open play.

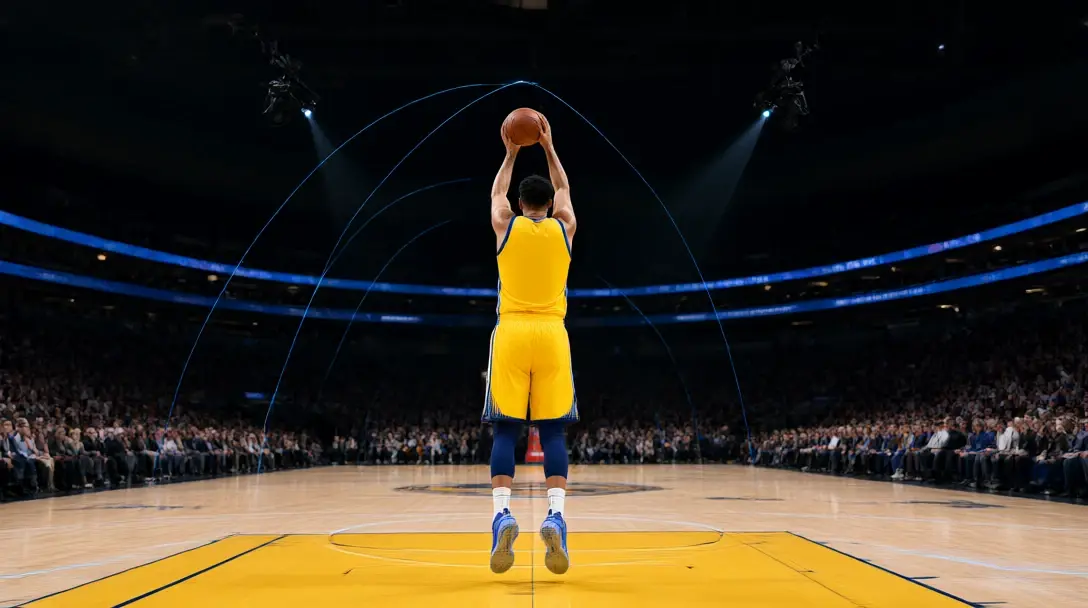
Basketball court with glowing optical-tracking shot arcs and rafter cameras over a shooter in yellow and blue
Tracking cameras let researchers adjust for shot difficulty for the first time.

Why your brain sees streaks that aren't there

If the real effect is so small, why does it feel so big? Because we're pattern-spotting machines, and we're hopeless at judging what randomness looks like.

Psychologists call it the clustering illusion: treating the clumps and streaks that inevitably turn up in small random samples as if they mean something. We expect randomness to alternate neatly, so the real thing looks too lumpy to be chance.

The classic example has nothing to do with sport. During the Second World War, Londoners came up with theories about patterns in where V-1 flying bombs were falling. In 1946 R. D. Clarke, writing in the Journal of the Institute of Actuaries, showed the hits fitted a random Poisson distribution closely. The patterns were in people's heads, not on the map. Gilovich later used the story in his 1991 book How We Know What Isn't So, and Kahneman and Tversky explained this whole family of mistakes through what they called the representativeness heuristic.

Then there's confirmation bias. We go into a game looking for a streak, we remember the runs that kept going and quietly forget the ones that fizzled out. If that sounds a bit like your own betting history, our guide to how confirmation bias costs you money is worth ten minutes of your time.

Key takeaway

The hot hand is real. It's just nowhere near as big as the price you're being asked to pay for it.

Anytime scorer streaks: the maths

This is where the hot hand hits your wallet. Football is low-scoring, so a striker's scoring "streak" sits on a tiny sample, and chance alone churns out far more of them than most punters realise.

Take a striker whose underlying rate is 0.4 goals per game. Treat his goals as a Poisson process and here's what luck alone does over a season in which he plays every game:

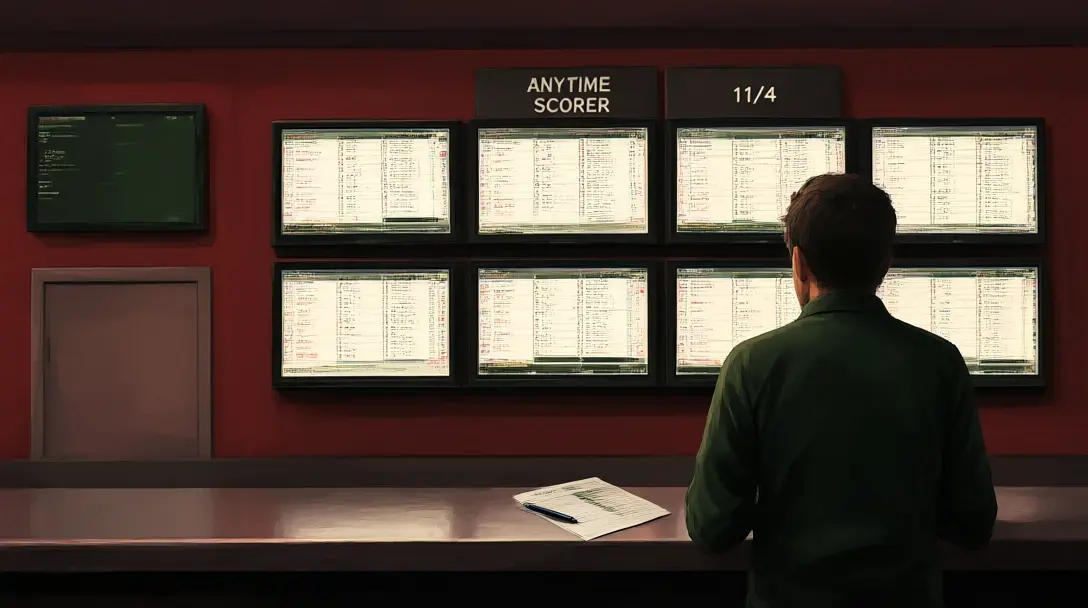
Punter seen from behind in a British betting shop reading anytime scorer odds on a wall of screens
Four goals in four games is a headline. Shot volume is the bet.
How often luck alone produces a four-game scoring run
Underlying scoring rate:          0.4 goals per game
P(scores in a given game)       = 1 - e^(-0.4) = 1 - 0.670 = 33.0%
P(scores in 4 specific games)   = 0.330^4 = 1.2%

Over a 38-game season:
Expected runs of 4+ scoring games ≈ p^4 × (1 + 34 × (1 - p))
                                  ≈ 0.0118 × 23.8
                                  ≈ 0.28 per player
P(at least one such run)          ≈ 25%, about one in four

Across 100 regular forwards       ≈ 28 runs of four or more

Sit with that for a second. A perfectly ordinary striker with no hot hand whatsoever has roughly a one-in-four chance of scoring in four straight at some point in the season. Spread that across a hundred regular forwards and you'd expect the best part of thirty "red-hot" runs every year from luck alone, each one arriving with a back-page headline and a shorter price.

What genuinely carries over from game to game isn't the run. It's shot volume, the quality of chances and penalty duties. A forward taking four shots a game who's on spot-kicks is a good anytime bet whether he's scored in four straight or none. A forward with four in four from five shots is riding his luck. Our anytime, first and last goalscorer guide shows how to weigh those numbers properly.

Hot team or lucky team?

Team streaks work the same way, with one twist: there's more genuine skill baked in. Squad quality changes slowly, so a side on a six-match winning run usually is a decent side. The real question is how much of the run is quality and how much is finishing, goalkeeping, deflections and the odd penalty that went their way.

The quality tends to stick around. The luck doesn't, and when it runs dry the streak ends in what looks like a sudden collapse but is mostly regression to the mean. We dig into that in our piece on regression to the mean in football betting, and our guide to form vs variance vs luck shows you how to pull the two apart.

Now the market side. Bookmakers know the public loves a streak, and money follows form. The side everyone's talking about rarely comes at a generous price, because the narrative is already in the odds and then some. When the hot hand is worth a percentage point or two and the market is charging you for a full-blown inferno, the value is usually on the other side, or nowhere at all.

How to bet around the hot hand

None of this means ignoring form. It means asking what's driving it before you pay for it. Run through this whenever a streak catches your eye:

The streak you see What to check Our read
Striker scored in four straight Shots per game, chance quality, penalty duties Back the volume, not the run
Team won six in a row Expected goals for and against over the run Shot-driven runs last; finishing-driven runs fade
Keeper on a clean-sheet streak Shots on target faced, chances conceded Saves well above normal rarely hold
Team lost five in a row, "due a win" The same underlying numbers It's the same error in reverse

Don't skip that last row. Doubling your stake because a player is "hot" and doubling it because a team is "due" are the same mistake in different shirts. Both treat a short sequence as if it tells you something the underlying numbers don't.

So the rule is simple. Price a streak by the quality underneath it, never by its length. If the numbers support the run, you'd have backed the player anyway. If they don't, the run is exactly why the price is too short.

Our betting angles on streaks

  • The hot hand exists, but it's tiny. The best basketball data puts it at 1.2 to 2.4 percentage points, so never let a streak shift your view by more than that.
  • Fade the headline, back the numbers. The striker with the shot volume and the penalties is the bet, not the one with a four-game run built on five shots.
  • Expect streaks to happen by chance. A 0.4-goals-a-game forward has roughly a one-in-four shot at a four-game scoring run every season with no hot hand at all.
  • Split team form into skill and luck. Runs built on chance creation keep going; runs built on finishing and goalkeeping are the ones to oppose.
  • Watch for the overreaction. Even professional baseball teams overreact to a player's last five attempts. We'd back the average punter to do it far worse, and that's where prices get stretched.
  • "Hot" and "due" are the same trap. Never raise your stakes off a streak in either direction.

Whatever the streak, keep your stakes flat and consistent. Good process outlasts any hot run, your own included.

Topics