Hero illustration showing portfolio betting concept with golden trending charts and emerald green accents representing diversification and risk management in sports betting
Strategy Guide

Portfolio Betting: Diversify Your Sports Bets Like a Pro

Jump to section

Introduction to Portfolio Betting

Walk into a financial advisor's office and announce you've invested your entire life savings into a single stock. They'd immediately flag this as dangerously reckless. Yet thousands of sports bettors make the equivalent mistake every day—concentrating their entire bankroll on one sport, one bet type, or one "sure thing."

The gap between casual gamblers who consistently lose and professionals who profit long-term isn't better picks or insider information. It's something far more fundamental: portfolio management.

Portfolio betting applies the same principles that govern investment management to sports wagering. Modern Portfolio Theory (MPT), developed by Nobel laureate Harry Markowitz, works equally well for betting markets as it does for stocks.

The numbers back this up. Bettors who employ portfolio-based strategies experience 30-40% lower volatility in their bankroll fluctuations and reduce their risk of ruin from over 50% to under 5%. That's not just an incremental improvement—that's the difference between going bust and staying in the game.

BettorEdge, December 2024

Diversifying in sports betting is like managing an investment portfolio: it's about spreading risk to improve stability and long-term gains. Instead of focusing on one sport or strategy, you can diversify by betting across different sports, markets, and bet types.

Greg Kajewski
Editorial illustration showing the variance trap concept with jagged volatile red lines versus smooth green curves, representing bankroll volatility and risk management
The Variance Trap: Even skilled bettors face daunting probability hurdles without proper diversification

Why Most Bettors Fail: The Dangers of Concentration

Before diving into portfolio construction, you need to understand why the conventional approach to sports betting leads to losses.

The Variance Trap

Even skilled bettors with legitimate edges face daunting probability hurdles. Research shows that with a 52% win rate—solidly above the 52.4% break-even required to beat the vig—there's still a 25% chance of losing money after 250 bets.

That's nearly one in four serious bettors who will lose money despite making positive expected value bets.

The numbers only become favorable after volume. After 1,000 bets with positive edge, success probability climbs to 90%. But most bettors never reach that volume because poor bankroll management wipes them out first.

The Risk of Ruin Problem

Without proper diversification, your risk of ruin—losing your entire bankroll—exceeds 50%. This mathematical reality means most concentrated bettors are statistically doomed to eventual bankruptcy, regardless of their handicapping skill.

The solution lies in allocation. Research shows that with proper portfolio allocation and risk controls, risk of ruin drops from 50%+ to under 5%. This tenfold improvement doesn't require better picks—just smarter capital deployment.

The Correlation Blindspot

Many bettors think they're diversifying by betting different teams or games, but they're actually exposing themselves to hidden correlation risks. Betting on five different NFL teams might feel diversified, but all five positions are exposed to the same league-wide factors: weather conditions, officiating crews, macro betting trends, and market overreactions.

True sports betting diversification requires understanding correlation between positions. Professional bettors allocate capital across uncorrelated or negatively correlated markets, ensuring that losses in one area are offset by gains elsewhere.

OddsJam, September 2022

Even with a 52% win rate edge, there's a 25% chance of losing money after 250 bets. After 1,000 bets, the probability of losing drops to roughly 10%. This demonstrates why proper bankroll management is essential.

Matt Modi

Modern Portfolio Theory Applied to Sports Betting

The mathematical framework that revolutionized investment management applies directly to sports betting. Understanding these principles transforms betting from guesswork into a systematic discipline.

The Core Insight: Risk-Adjusted Returns

Raw ROI tells only part of the story. A 10% ROI with 50% volatility is inferior to a 7% ROI with 20% volatility. The former requires enormous emotional tolerance for drawdowns and increases ruin risk, while the latter provides sustainable growth.

This is why professional bettors increasingly use the Sharpe Ratio—the same metric hedge funds use to evaluate performance.

The Sharpe Ratio measures return per unit of risk:

  • Sharpe Ratio above 1.0: Good performance
  • Sharpe Ratio above 2.0: Very good performance
  • Sharpe Ratio above 3.0: Excellent performance

Bettors tracking this metric consistently make better allocation decisions than those focusing solely on win rate or ROI.

Academic Validation

The application of portfolio theory to betting isn't just practical—it's academically validated.

Research confirms that uncorrelated bets smooth out returns and protect against catastrophic losses in any single area. This mathematical truth underpins the entire portfolio betting approach.

Oskeim Sports Picks, August 2025

The Sharpe Ratio isn't just for Wall Street—it's a powerful way for sports bettors to measure efficiency and sustainability. By weighing profits against volatility, it highlights strategies that balance reward and risk.

Jeff Keim

Kelly Criterion: Optimal Position Sizing for Your Betting Portfolio

Proper position sizing is the cornerstone of portfolio management. The Kelly Criterion, developed at Bell Labs in 1956, provides a mathematically optimal method for sizing bets to maximize long-term bankroll growth.

Understanding the Kelly Formula

The Kelly Criterion calculates the optimal percentage of your bankroll to wager based on your edge and the odds offered.

Kelly Criterion Formula
f* = (bp - q) / b

Where:
f* = percentage of bankroll to wager
b = net odds received (decimal odds - 1)
p = probability of winning
q = probability of losing (1 - p)

Practical Example: Kelly Criterion in Action

Consider a scenario where you find a moneyline underdog at +150 (decimal 2.50):

The Setup:

  • Team A moneyline at +150 (decimal 2.50)
  • Your analysis says they have 45% chance to win (p = 0.45)
  • Net odds: b = 1.5 (profit of $1.50 for every $1 bet)

Kelly Calculation:

Kelly Calculation Example
f* = (1.5 × 0.45 - 0.55) / 1.5
f* = (0.675 - 0.55) / 1.5
f* = 0.125 / 1.5
f* = 0.0833 or 8.33% of bankroll

Example with $10,000 bankroll:
Full Kelly wager = $10,000 × 0.0833 = $833

The Problem with Full Kelly

While mathematically optimal, full Kelly betting creates unacceptable volatility for most bettors. Research shows that even with a legitimate edge, full Kelly can result in drawdowns exceeding 50%. These swings test emotional discipline and often lead to strategy abandonment during inevitable losing streaks.

The Solution: Fractional Kelly

Professional bettors almost universally use fractional Kelly—betting a fixed percentage of the full Kelly recommendation. The tradeoff is favorable:

Fraction Return Capture Volatility Recommended For
Full Kelly (100%) 100% 100% Aggressive professionals
3/4 Kelly ~90% ~65% Experienced bettors
Half Kelly 71% 38% Most bettors (recommended)
Quarter Kelly 45% 15% Conservative beginners
Kelly Fraction Tradeoffs: Return vs Volatility
Editorial illustration of Kelly Criterion position sizing concept with graduated pie charts showing fractional allocation, golden betting chip stacks in ascending sizes
Position Sizing: The Kelly Criterion provides mathematically optimal bet sizing to maximize long-term growth

tastylive, May 2025

Kelly is pretty aggressive compared to most people's risk tolerance. The half-Kelly strategy can capture nearly 71% of the optimal returns with only about 38% of the volatility.

Kai Zeng

Position Sizing by Confidence Level

Half-Kelly hits the sweet spot for most serious bettors. You sacrifice only 29% of potential returns while reducing volatility by 62%.

Within a fractional Kelly framework, adjust position sizes based on confidence in your edge:

Confidence Edge Size Position Size Fraction of Kelly
Very High 5%+ 3% max Quarter-Kelly
High 3-5% 2% max Quarter-Kelly
Medium 1-3% 1% max Eighth-Kelly
Low <1% 0.5% max No bet (pass)
Position Sizing by Confidence Level

Building Your Betting Portfolio: Step-by-Step Strategy

Constructing a diversified betting portfolio follows the same systematic process as building an investment portfolio. Each step builds on the previous, creating a comprehensive risk management sports betting framework.

Step 1: Determine Total Bankroll

Your betting bankroll should be money you can afford to lose, completely separated from living expenses. This separation protects your financial stability and ensures rational decision-making.

Recommended minimum: 50-100 units (where 1 unit = 1-2% of bankroll)

For example, a $5,000 bankroll with 1% units gives you 50 units to deploy across positions.

Step 2: Choose Your Allocation Strategy

Different risk profiles require different allocations. Here are three portfolio models from conservative to aggressive:

Conservative Portfolio

  • 40% - Major sports (moneylines, spreads on NFL/NBA/MLB)
  • 30% - Secondary markets (totals, props)
  • 20% - Niche opportunities (tennis, UFC, lower leagues)
  • 10% - Reserve/cash

Balanced Portfolio (Recommended for Most Bettors)

  • 55% - Major sports
  • 25% - Secondary markets
  • 15% - Niche opportunities
  • 5% - Reserve/cash

Aggressive Portfolio

  • 65% - Major sports
  • 20% - Secondary markets
  • 15% - Niche opportunities
  • 0% - Reserve/cash (not recommended)

Step 3: Select Bet Types Within Each Category

Major Sports (55% allocation of bankroll):

  • 50% single bets (spreads, moneylines, totals)
  • 20% 2-leg parlays
  • 15% live betting
  • 10% futures
  • 5% props

Secondary Markets (25% allocation):

  • 40% player props
  • 30% team totals
  • 20% live betting opportunities
  • 10% alternative lines

Niche Opportunities (15% allocation):

  • 50% smaller sports/leagues
  • 30% specialized props
  • 20% experimental strategies

Step 4: Set Position Sizing Rules

Base Units:

  • 1 unit = 1% of total bankroll
  • Standard bets: 1-2 units
  • Strong edges: 2-3 units (max)
  • Niche/experimental: 0.5-1 unit

Maximum Exposure:

  • Per game: 5 units (5% of bankroll)
  • Per sport: 30% of bankroll
  • Per bet type: 20% of bankroll

Step 5: Implement Risk Management Controls

Daily Limits:

  • Maximum loss: 20% of bankroll
  • Maximum total wagered: 30% of bankroll
  • Stop loss: Hit maximum loss, stop betting for day

Weekly Review:

  • Calculate ROI by sport/bet type
  • Check Sharpe Ratio
  • Adjust allocations if category underperforming for 3+ weeks

Monthly Rebalancing:

  • Shift capital from underperforming to outperforming categories
  • Reassess overall sports betting strategy
  • Calculate risk of ruin

February 2025

Risk management involves identifying, assessing, and managing the risks associated with sports betting. Effective risk management requires players to be strategic and disciplined instead of wagering randomly.

European Financial Review

Understanding Correlation: The Hidden Risk Factor in Sports Betting

Correlation is the single most misunderstood concept in sports betting risk management. Proper correlation analysis separates sophisticated portfolio managers from amateurs who think they're diversified but aren't.

What Is Correlation in Betting?

Correlation measures how two bets move relative to each other. Understanding these relationships helps you build true diversification rather than superficial variety.

Positive Correlation: The Risk Multiplier

Positive correlation means bets tend to win or lose together. Examples include:

1. Team Total Over + Team Moneyline

  • When a team scores more, they're more likely to win
  • Correlation strength: 0.6-0.7
  • Portfolio impact: Concentrates risk rather than diversifying

2. NBA Team Total Over + Over Game Total

  • If one team scores more, game total more likely to go over
  • Correlation strength: 0.4-0.5
  • Portfolio impact: Moderate risk concentration

3. Starting Pitcher Strikeouts + Team Total Under

  • More strikeouts = fewer runs scored
  • Correlation strength: 0.5-0.6
  • Portfolio impact: Creates hidden exposure to pitcher performance

Negative Correlation: Natural Hedges

Negative correlation means bets move in opposite directions. When one loses, the other tends to win. Examples include:

1. Team Moneyline + Opposing Team Total Over

  • If Team A wins decisively, Team B likely scored fewer runs
  • Correlation strength: -0.5 to -0.6
  • Portfolio impact: Creates natural hedge

2. Game Total Under + Both Teams to Score Yes

  • Lower scoring game reduces both teams scoring probability
  • Correlation strength: -0.4 to -0.5
  • Portfolio impact: Partial hedge

Uncorrelated Markets: The Diversification Ideal

Uncorrelated markets provide true diversification—the foundation of portfolio theory.

1. NFL Spread + NBA Props

  • Completely different sports, zero correlation
  • Perfect for risk distribution

2. MLB First Five Innings + Full Game

  • Different dynamics (bullpen vs starters)
  • Low correlation (0.1-0.2)

3. Pre-game bets vs Live bets

  • Different information sets and timing
  • Low correlation when properly structured

Correlation Risk Management Rules

Portfolio Construction Guidelines:

  • 40% uncorrelated positions
  • 35% low correlation (0.1-0.3)
  • 25% medium correlation (0.3-0.5)
  • 0% high correlation (>0.5)

Position Limits:

  • Never allocate more than 10-15% of bankroll to highly correlated positions (correlation >0.5)
  • Aggregate correlated bets when calculating true exposure
  • Use correlation software or spreadsheets to track relationships

March 2025

Correlation in sports betting means understanding how one event's outcome can affect another. Combining bets with positive correlation can increase potential payouts, while avoiding negative correlation can save you from losses.

BettorEdge Research

Portfolio Rebalancing: When and How to Adjust Your Betting Strategy

Markets change. Performance shifts. A well-constructed portfolio requires periodic maintenance to maintain optimal risk-reward characteristics. This process—rebalancing—is as important as initial allocation.

When to Rebalance Your Betting Portfolio

Time-Based Rebalancing (Passive):

  • Monthly rebalancing (most common)
  • Quarterly rebalancing (lower transaction costs)
  • Semi-annual rebalancing (more stable)

Threshold-Based Rebalancing (Active):

  • When any category drifts >5% from target allocation
  • When bankroll changes by >25%
  • After major winning/losing streaks

Rebalancing Methods for Sports Betting

1. Percentage Threshold Method

Rebalance when allocation drifts 5%+ from target. For example, if your target allocation for NFL is 50% but actual performance has grown it to 55%, rebalance back to 50%.

2. Calendar Method

Rebalance on a fixed schedule (e.g., first of each month). This approach provides simplicity and emotionless execution, working well for steady bettors.

3. Volatility-Based Method

Rebalance more frequently during high volatility periods and reduce frequency during stable periods. This requires monitoring standard deviation and adjusting based on market conditions.

Rebalancing Example: Practical Application

Initial Allocation ($10,000 bankroll):

  • Major Sports: $5,500 (55%)
  • Secondary Markets: $2,500 (25%)
  • Niche: $1,500 (15%)
  • Reserve: $500 (5%)

After 3 Months ($12,000 bankroll):

  • Major Sports: $7,200 (60%) - Overweight
  • Secondary Markets: $2,400 (20%) - Underweight
  • Niche: $1,800 (15%) - On target
  • Reserve: $600 (5%) - On target

Rebalancing Action:

  • Move $720 from Major Sports to Secondary Markets
  • New allocation: Major Sports $6,480 (54%), Secondary Markets $3,120 (26%)
  • Closer to target percentages with appropriate drift tolerance

This systematic approach ensures you're systematically selling high and buying low—automatically capturing profits from outperforming categories and allocating capital to areas with better future potential.

Performance Measurement: Tracking What Matters in Sports Betting

You can't improve what you don't measure. Professional bettors track extensive metrics to evaluate performance and guide allocation decisions. Casual bettors typically track only wins and losses—one reason they remain casual.

Essential Metrics for Portfolio Management

1. ROI (Return on Investment)

ROI = (Net Profit / Total Amount Wagered) × 100
  • Target: 3-7% for professional bettors
  • Track overall and by category
  • Provides objective performance measurement

2. Yield (Profit per Stake)

Yield = (Net Profit / Total Stakes) × 100
  • Useful for comparing across different stake sizes
  • Target: 4-8%
  • Normalizes for volume differences

3. Win Rate

Win Rate = (Winning Bets / Total Bets) × 100
  • Break-even: 52.4% (with vig)
  • Professional: 55-57%
  • Important but insufficient alone

4. Sharpe Ratio (Risk-Adjusted Return)

Sharpe Ratio = (Return - Risk-Free Rate) / Standard Deviation
  • Good: >1.0
  • Very Good: >2.0
  • Excellent: >3.0
  • Critical for portfolio optimization

5. CLV (Closing Line Value)

CLV = ((Your Odds / Closing Odds) - 1) × 100
  • Positive CLV indicates finding value early
  • Strong predictor of long-term success
  • Measures market timing skill

6. Maximum Drawdown

Maximum decline from peak to trough
  • Acceptable: 20-30%
  • Warning: 30-50%
  • Danger: >50%
  • Essential for risk assessment

7. Risk of Ruin

Probability of losing entire bankroll
  • Acceptable: <5%
  • Conservative: <1%
  • Calculate before increasing stakes
Category Bankroll ROI Yield Win Rate Sharpe Max DD
Overall $12,500 5.2% 5.8% 54.3% 1.8 -22%
NFL $4,500 6.1% 6.5% 55.1% 2.1 -18%
NBA $3,000 4.8% 5.2% 53.8% 1.5 -25%
MLB $2,500 3.9% 4.3% 52.9% 1.2 -28%
Props $1,500 7.2% 7.8% 56.2% 2.4 -15%
Live Betting $1,000 4.1% 4.5% 51.7% 1.3 -30%
Sample Performance Dashboard: Props outperform with lower risk suggests allocation increase. Live betting underperforming with higher volatility suggests reduction.

Tracking Best Practices

This dashboard immediately reveals allocation opportunities: Props outperforming with lower risk suggests allocation increase. Live betting underperforming with higher volatility suggests reduction.

Minimum Tracking Columns:

  • Date
  • Sport/League
  • Bet Type
  • Odds
  • Stake
  • Result
  • Profit/Loss
  • Running Bankroll

Advanced Metrics to Add:

  • CLV for each bet
  • Kelly fraction used
  • Confidence level
  • Correlation with other active bets
Editorial illustration of correlation analysis with network diagram showing positive, negative, and uncorrelated betting relationships
Correlation Analysis: Understanding how bets move together is essential for true diversification

January 2024

Right-sizing positions are critical for risk management. Risk only 1-5% of your account per trade depending on conviction level and volatility. This ensures one errant trade can't cripple your capital.

SportsTrade

Real-World Portfolio Examples: Sports Betting Strategies in Action

Theory is useful, but practical examples show how portfolio betting looks in practice. Here are three portfolio models from conservative to aggressive, each designed for different risk profiles and bankroll sizes.

Example 1: Conservative NFL-Focused Bettor

Profile: $5,000 bankroll, focuses primarily on football

Allocation:

  • NFL Spreads/Moneylines: 50% ($2,500)
    • 5-7 games per week
    • 2% per bet (max 3% on strong edges)
    • Mix of sides and totals
  • NFL Props: 20% ($1,000)
    • Player props (yards, TDs)
    • 1-2% per bet
    • Higher volume, smaller stakes
  • College Football: 15% ($750)
    • Spreads and totals
    • 1.5% per bet
    • More selective
  • NBA/MLB: 10% ($500)
    • Best opportunities only
    • 1-2% per bet
    • Learning phase
  • Other Sports/Reserve: 5% ($250)
    • UFC, tennis, golf
    • Experimental bets
    • 0.5-1% per bet

Risk Profile: Low variance, steady growth target 3-4% ROI

This approach concentrates capital where the bettor has most expertise while maintaining exposure to other opportunities. The reserve fund provides psychological security and emergency capital.

Example 2: Balanced Multi-Sport Portfolio

Profile: $10,000 bankroll, experienced across multiple sports

Allocation:

  • NFL: 25% ($2,500)
    • Spreads, totals, props
    • 2-3% per bet
    • 8-12 bets per week
  • NBA: 20% ($2,000)
    • Spreads, totals, live betting
    • 2% per bet
    • 10-15 bets per week
  • MLB: 15% ($1,500)
    • Spreads, totals, first-five
    • 1.5-2% per bet
    • 5-8 bets per day
  • Props (All Sports): 20% ($2,000)
    • Player props across NFL/NBA/MLB
    • 1-2% per bet
    • High volume approach
  • Live Betting: 10% ($1,000)
    • In-game opportunities
    • 1-2% per bet
    • React to game flow
  • Futures/Long-term: 5% ($500)
    • Season-long bets
    • 1% per bet
    • Championship winners, awards
  • Reserve: 5% ($500)
    • Emergency fund
    • Not deployed unless needed

Risk Profile: Moderate variance, growth target 5-7% ROI

This balanced approach provides true sports betting diversification across sports, bet types, and time horizons. The 15% allocation to niche markets (props, live betting, futures) provides growth potential while the core sports (NFL, NBA, MLB) offer stability.

Example 3: Aggressive Professional Bettor

Profile: $25,000 bankroll, full-time bettor with proven edge

Allocation:

  • Core Strategy (Proven Models): 50% ($12,500)
    • NFL, NBA, MLB primary sports
    • 2-4% per bet
    • 50-75 concurrent positions
  • Secondary Strategy (Emerging Edges): 25% ($6,250)
    • New markets, experimental
    • 1-2% per bet
    • 20-40 concurrent positions
  • Live/In-Play: 15% ($3,750)
    • Real-time opportunities
    • 2-3% per bet
    • Rapid turnover
  • Arbitrage/Middling: 5% ($1,250)
    • Risk-free or low-risk opportunities
    • As opportunities arise
    • Variable sizing
  • Reserve: 5% ($1,250)
    • Ready for major opportunities
    • Not deployed regularly

Risk Profile: Higher variance, growth target 8-12% ROI

This professional approach uses proven systems as the foundation while allocating significant capital to experimental strategies and emerging edges. The arbitrage/middling allocation provides low-risk return opportunities when they arise.

Each portfolio reflects the bettor's expertise, risk tolerance, and goals. The key is matching allocation to reality—not aspiration.

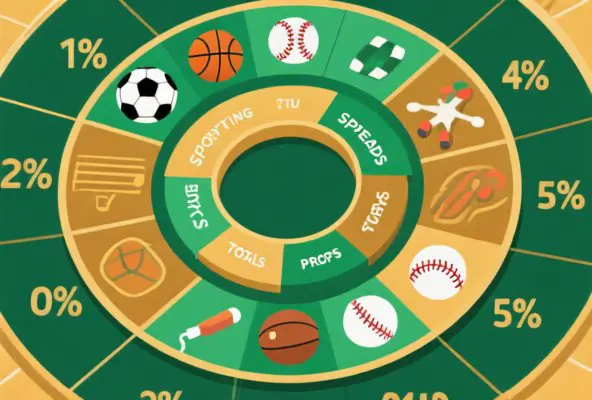
Editorial illustration of diversified betting portfolio with visual representation of different sports and bet types spread across categories
Diversified Portfolio: Spreading capital across uncorrelated markets reduces volatility and risk of ruin

Common Portfolio Mistakes to Avoid in Sports Betting

Even bettors who understand portfolio theory can make implementation errors that undermine their strategy. Recognizing and avoiding these mistakes is essential for long-term success.

1. Overconcentration in Single Sport or League

Mistake: Betting 80%+ of bankroll on one sport (e.g., only NFL)

Consequence: One bad season can wipe out entire bankroll

Solution: Limit any single sport to 50-60% maximum allocation

The math is unforgiving. If your edge in NFL disappears for a season (injury, coaching changes, scheme evolution), an 80% concentrated portfolio faces catastrophic losses regardless of your skill level.

2. Chasing Losses with Increased Bet Sizes

Mistake: Doubling or tripling bet sizes after losses to "win it back"

Consequence: Accelerated bankroll depletion, emotional decision-making

Solution: Fixed percentage betting, maximum 3% per wager regardless of recent results

This is the single biggest destroyer of sports betting bankrolls. Emotional bet sizing breaks all portfolio math and converts variance into ruin. Learn more about this cognitive bias in our guide on the Gambler's Fallacy.

3. Ignoring Correlation in Parlays

Mistake: Creating correlated parlays without understanding risk

Consequence: Hidden risk concentration, false sense of diversification

Solution: Limit correlated parlays to 1-2% of bankroll, analyze true correlations

A 4-team parlay might feel like diversification across four games, but if all four bets are correlated (e.g., four favorites in NFL), you're actually concentrating risk, not spreading it.

4. No Stop-Loss Limits

Mistake: Betting continuously through losing streaks without daily limits

Consequence: Losing 30-50% of bankroll in single day during bad variance

Solution: Set 20% daily stop-loss maximum, strictly enforced

Professional traders use daily loss limits for a reason. Bad days happen. Stop-loss limits ensure one bad day doesn't become a catastrophic month.

5. Inadequate Record Keeping

Mistake: Not tracking ROI by sport, bet type, or time period

Consequence: Unable to identify what's working, repeated mistakes

Solution: Track at minimum: ROI, yield, win rate, CLV by category

You can't optimize what you don't measure. Detailed records reveal which strategies deserve increased allocation and which should be abandoned.

6. Full Kelly Betting Without Adjustment

Mistake: Using full Kelly Criterion without fractional adjustment

Consequence: Excessive volatility, 50%+ drawdowns even with edge

Solution: Use half-Kelly or quarter-Kelly for sustainable growth

The theory is sound, but practical implementation requires adjustment for real-world uncertainty and estimation error.

7. Ignoring Risk of Ruin Calculations

Mistake: Not calculating or considering probability of losing entire bankroll

Consequence: Inadequate bankroll sizing, inevitable ruin

Solution: Keep risk of ruin under 5%, calculate before increasing stakes

Every betting strategy has a risk of ruin. Professional bettors calculate this number explicitly and adjust position sizing to keep it under 5%.

8. Betting Without Positive Expected Value

Mistake: Placing bets based on fandom or "gut feeling" rather than mathematical edge

Consequence: Long-term losses due to vig

Solution: Only bet when positive expected value identified

Portfolio management optimizes allocation of positive EV bets. It can't turn negative EV bets into long-term profits.

9. Neglecting Niche Markets

Mistake: Only betting major markets with sharp lines

Consequence: Missing value opportunities in less efficient markets

Solution: Allocate 10-15% to niche opportunities (props, smaller leagues)

The most inefficient markets often offer the best edges. Smart bettors allocate a portion of their portfolio to these opportunities.

10. Emotional Decision Making

Mistake: Letting recent results dictate next bets rather than strategy

Consequence: Deviating from proven systems, increased variance

Solution: Follow predetermined strategy regardless of short-term results

The best strategies have losing weeks and even losing months. Emotional responses to this natural variance destroy more bankrolls than bad handicapping.


The sports betting landscape is evolving rapidly, and portfolio betting approaches are advancing alongside technology and market maturation. Understanding these trends helps position your strategy for long-term success.

Integration of AI and Machine Learning

Trend: Bettors using AI models to identify value across multiple markets simultaneously

Impact: Enables true portfolio management with 50+ concurrent positions

Timeline: Growing rapidly in 2025-2026

AI systems can monitor thousands of betting markets simultaneously, identifying value opportunities that human bettors miss. This technology enables portfolio construction at scale, with algorithms managing correlation and position sizing automatically.

Rise of Betting Exchanges

Trend: Shift from traditional sportsbooks to peer-to-peer platforms

Key Players: BettorEdge, Prophet Exchange, Betfair

Growth: 40% of serious bettors now using exchanges (up from 15% in 2023)

Exchanges dramatically improve portfolio returns by eliminating or reducing vig. Research shows peer-to-peer platforms demonstrate 40% profitability rates versus 2% on traditional platforms.

Correlation Betting Sophistication

Trend: Advanced correlation analysis between seemingly unrelated markets

Example: Weather patterns affecting both totals and player props

Tool Development: Automated correlation detection systems

Professional bettors increasingly use sophisticated correlation analysis to identify hidden relationships and create genuinely diversified portfolios. This mathematical approach outperforms gut-feeling diversification.

Multi-Sport Portfolios

Trend: Professional bettors diversifying across 5+ sports simultaneously

Reason: Year-round opportunities and reduced sport-specific risk

Popular Mix: NFL (40%), NBA (25%), MLB (20%), UFC/Other (15%)

Single-sport specialists face enormous risk when that sport's season ends or market dynamics change. Multi-sport portfolios provide consistent opportunity and reduce dependency on any single market.

Performance Analytics Evolution

Trend: Sharpe Ratio and risk-adjusted metrics becoming standard

Tool Integration: ROI, CLV, yield tracking now automated across platforms

Benchmarking: Bettors comparing Sharpe Ratios across strategies

The amateur approach of tracking wins and losses is being replaced by professional-grade performance analytics. This data-driven approach enables continuous optimization and better allocation decisions.

Regulatory Changes

Trend: More US states legalizing sports betting

Impact: Increased market efficiency, requiring more sophisticated approaches

Opportunity: More markets available for diversification

As markets mature and become more efficient, portfolio management becomes increasingly important. The easy edges disappear, replaced by opportunities for those with systematic approaches.

2024

The elimination of the house edge on peer-to-peer platforms means users don't have to contend with built-in margins that favor the sportsbook. This allows for more competitive odds and greater flexibility in betting strategies.

BettorEdge Research
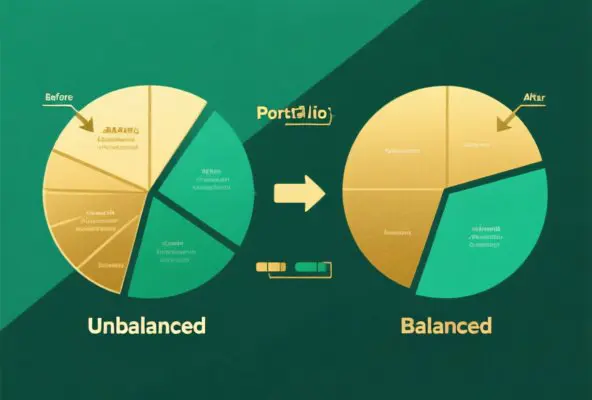
Editorial illustration of portfolio rebalancing concept with before and after allocation charts, showing capital shifting between categories
Portfolio Rebalancing: Systematic adjustment ensures optimal risk-reward characteristics over time

Implementation Checklist: Getting Started with Portfolio Betting

Transforming from recreational bettor to portfolio manager requires a systematic implementation process. Follow this phased approach to build your diversified betting portfolio.

Phase 1: Setup (Week 1)

  • Determine total bankroll (money you can afford to lose)
  • Choose tracking method (spreadsheet, app, platform)
  • Set up accounts at 2-3 sportsbooks or exchanges
  • Define target allocation percentages
  • Create performance dashboard

The setup phase establishes your foundation. Don't rush this—proper infrastructure prevents problems later.

Phase 2: Initial Allocation (Week 2)

  • Deploy 50% of bankroll across major sports
  • Start with 1% unit size (1% per bet)
  • Focus on 2-3 sports you know best
  • Track all bets with detailed metrics

Start conservatively. Prove your approach works before scaling up. The goal in Phase 2 is learning and establishing baseline metrics.

Phase 3: Expansion (Month 1-2)

  • Add 1-2 new sports/leagues
  • Introduce props or secondary markets
  • Calculate Sharpe Ratio for each category
  • Adjust allocation based on early results

As you gain data, expand into new opportunities. Let performance guide allocation—deploy more capital to what's working, reduce what isn't.

Phase 4: Optimization (Month 3+)

  • Implement fractional Kelly sizing
  • Add live betting component
  • Begin monthly rebalancing
  • Track CLV and other advanced metrics
  • Consider betting exchange for better odds

By Month 3, you should have meaningful data across categories. Use this information to optimize your portfolio systematically.

Phase 5: Advanced Strategies (Month 6+)

  • Explore correlated betting strategies
  • Add niche markets for additional diversification
  • Implement automated tracking/analytics
  • Consider portfolio backtesting
  • Explore AI/ML tools for edge identification

Advanced strategies require proven foundation. Don't rush to Phase 5 until you've consistently profited in Phases 1-4.

Key Takeaways: The Portfolio Betting Advantage

Portfolio betting transforms sports gambling from a recreational activity into a disciplined investment process. The principles are straightforward, but the execution requires commitment and discipline.

Core Principles of Successful Portfolio Betting

1. Diversification works - Spreading bets across uncorrelated markets reduces volatility by 30-40% and risk of ruin from 50%+ to under 5%

2. Position sizing matters - Fractional Kelly provides optimal balance of growth and risk. Half-Kelly captures 71% of returns with only 38% of volatility

3. Metrics drive success - Tracking ROI, Sharpe Ratio, and CLV separates professional bettors from amateurs who rely on gut feeling

4. Discipline is essential - Following a system through variance determines long-term results. The best strategies have losing months

5. Continuous improvement - Regular rebalancing and performance analysis leads to optimization. Static strategies get exploited by evolving markets

The Professional Mindset for Sports Betting

Success in portfolio betting requires treating it as a serious business, not a hobby. The bettors who succeed are those who:

  • Accept variance as part of the game - Even the best strategies have losing streaks
  • Stick to their strategy through losing periods - Emotional deviations destroy expected value
  • Make data-driven decisions - Numbers don't lie; feelings do
  • Continuously educate themselves - Markets evolve; you must too
  • Maintain emotional discipline - Process over results, always

Next Steps for Your Betting Portfolio

The transition to portfolio betting doesn't happen overnight. Start with:

  1. Audit your current approach - Calculate your risk of ruin and Sharpe Ratio
  2. Set up proper tracking - You can't optimize what you don't measure
  3. Choose your allocation model - Conservative, balanced, or aggressive
  4. Implement fractional Kelly - Start with half-Kelly and adjust based on results
  5. Commit to the process - Give your strategy at least 3-6 months before judging

The mathematics favors the disciplined. The portfolio approach doesn't guarantee wins—nothing in sports betting does—but it dramatically improves your risk-adjusted returns and probability of long-term success.

Additional Resources for Portfolio Betting

Books on Sports Betting Strategy

  • "Sharp Sports Betting" by Stanford Wong
  • "Conquering Risk: Attacking Vegas and Wall Street" by Elihu D. Feustel
  • "Scorecasting" by Tobias J. Moskowitz

Academic Papers on Portfolio Theory

  • "Modern and post-modern portfolio theory as applied to moneyline betting" (Harville, 2023)
  • "Optimal sports betting strategies in practice" (Uhrín et al., 2021)
  • "Exploiting sports-betting market using machine learning" (Hubáček et al., 2019)

Tools & Platforms for Bankroll Management

  • BettorEdge (peer-to-peer betting exchange)
  • OddsJam (positive EV betting tools)
  • Action Network (analytics and community)
  • Bet-Analytix (bankroll management)

Communities for Sports Bettors

  • r/sportsbook (Reddit)
  • Covers.com forums
  • Sports Betting Review Discord

Disclaimer: This article is for educational purposes only. Sports betting involves risk. Never bet more than you can afford to lose. Past performance does not guarantee future results.

Key Insight

The transition to portfolio betting doesn't happen overnight. Start small, track everything, and give your strategy at least 3-6 months before judging results. Consistency and discipline beat complexity every time.

Professional Betting Principles
Editorial illustration of performance analytics dashboard showing key metrics like ROI, Sharpe Ratio, and yield in visual charts
Performance Metrics: Tracking the right measurements separates professional bettors from amateurs

Dive deeper into sports betting strategy with these related guides: