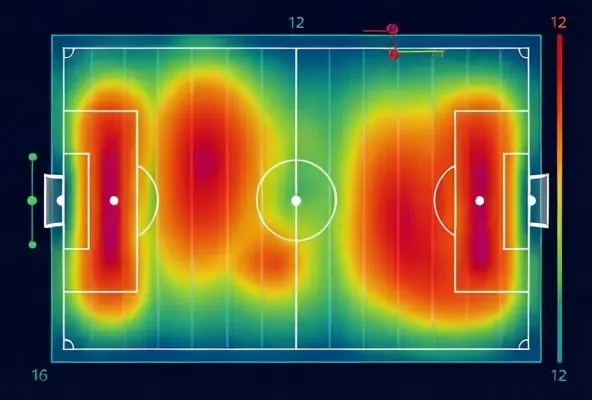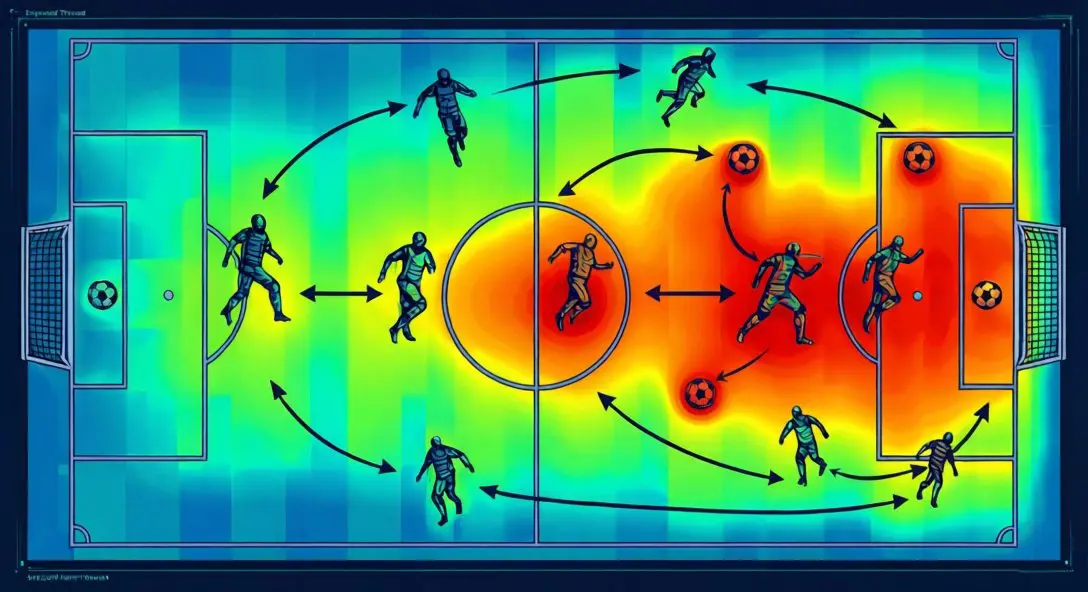
Expected Threat (xT) heatmap visualization across a football pitch showing danger zones with color gradients from defensive to attacking areas

Expected Threat (xT) Explained: Beyond xG

Jump to section

Introduction

In December 2018, Arsenal scored a brilliant team goal against Burnley. Mesut Ozil played a perfectly weighted through ball to Sead Kolasinac, who squared it across the face of goal for Pierre-Emerick Aubameyang to tap in. The assist went to Kolasinac. The goal to Aubameyang. But who really created the chance?

According to Expected Threat (xT), Ozil deserved 86% of the credit. His through ball increased Arsenal's probability of scoring within the next five actions from 7.7% to 15.8%. Kolasinac's cutback added just 1.3 percentage points. The assist statistic told one story. xT revealed another entirely.

This is the power of Expected Threat in football analytics. Traditional metrics focus on terminal actions - shots, goals, assists. xT captures the buildup play that makes those moments possible. Think of it like analyzing a chess match based on the moves leading to checkmate, not just the final capture.

What is Expected Threat (xT) in Football Analytics?

Expected Threat (xT) is a football analytics metric that quantifies how every pass, carry, and dribble changes a team's probability of scoring. Expected Goals (xG) measures the probability of a shot becoming a goal. xT values all actions on the pitch - even those that never lead to a shot.

The concept is beautifully simple. Each zone on the football pitch has a "threat value" based on how often possession in that zone leads to a goal within the next few actions. When a player moves the ball from one zone to another, the difference in threat values represents their contribution.

Picture the pitch divided into a grid. Possession near your own goal might have a threat value of 0.01 (1% chance of scoring within five actions). Possession on the penalty spot might have a value of 0.35 (35% chance). A pass from your own half to the edge of the opponent's box gains territory, sure. But it also mathematically increases the probability of scoring.

Key difference - xG vs xT: xG only values shots. xT values everything that happens before the shot.

The xT Formula: How Expected Threat is Calculated

The mathematical foundation uses an iterative approach that considers two options at any position: shoot or move the ball.

The Expected Threat Formula
xT(x,y) = (s(x,y) * g(x,y)) + (m(x,y) * sum[T((x,y)->(z,w)) * xT(z,w)])

Where:
- s(x,y) = probability of shooting from zone (x,y)
- g(x,y) = probability of scoring when shooting from zone (x,y)
- m(x,y) = probability of moving the ball from zone (x,y)
- T = transition matrix showing where the ball moves next

Understanding the Iterative Process

The algorithm runs iteratively until values converge, typically after 4-5 iterations. Each iteration represents one additional action in the chain of play. After five iterations, xT shows the probability of scoring within the next five actions from that position.

Football pitch divided into grid zones with threat values showing the 16x12 Expected Threat calculation system, color-coded cells from blue low threat to red high threat zones
The 16x12 grid divides the pitch into 192 zones, each with unique threat values derived from historical scoring patterns

The Origin Story: From Academic Paper to Mainstream Football Metric

The mathematical framework behind xT predates its popular name by nearly a decade. In 2011, Sarah Rudd presented "A framework for tactical analysis and individual offensive production assessment in soccer using Markov chains" at the New England Symposium on Statistics in Sports (NESSIS) at Harvard.

Rudd's model divided the pitch into states (Box, Wing, Midfield, Goal, Lost) and calculated the probability of eventually scoring from each state using Markov chains. Her work was groundbreaking. Her model ranked a young Jordan Henderson, then at Sunderland, as a top-25 Premier League player while prolific striker Darren Bent ranked poorly. Henderson was signed by Liverpool for under 20 million pounds and went on to captain the club to Premier League and Champions League glory. Bent moved to Aston Villa for 24 million pounds and never reached the same heights.

Rudd was recruited by Arsenal and now runs a leading sports analytics company. The industry had taken notice.

But Karun Singh brought these ideas to the broader football community. His December 2018 blog post introduced the name "Expected Threat," provided interactive visualizations, and offered open-source implementation details that democratized the metric.

Singh's contribution was not just naming the metric. He made it accessible. His blog post remains a reference point cited by everyone from The Athletic to academic research papers.

Creator of Expected Threat

The purpose of this exercise isn't to converge on a universally accepted answer, but rather to show that breaking down buildup play and assigning credit to individual actors is a hard problem.

Karun Singh

How xT is Calculated: The Grid System in Advanced Football Statistics

The most common implementation divides the pitch into a 16x12 grid, creating 192 zones. Each zone has four key attributes derived from historical data:

  1. Move probability (m): How often players pass or dribble from this zone
  2. Shoot probability (s): How often players shoot from this zone (note: m + s = 1)
  3. Transition matrix (T): Where the ball tends to move when players pass or dribble from this zone
  4. Goal probability (g): Conversion rate when shooting from this zone

The Iterative Computation Process

The algorithm starts with all zones initialized to zero threat and iteratively refines the values:

  • Iteration 0: All zones have xT = 0
  • Iteration 1: Effectively an xG model - only shooting is considered
  • Iteration 2: Considers "move, then shoot" possibilities
  • Iteration 3: Considers "move, move, shoot" sequences
  • Iterations 4-5: Values converge, capturing scoring probability within five actions

This iterative approach makes xT interpretable. After n iterations, the xT value represents the probability of scoring within the next n actions. Five iterations is typically sufficient because longer sequences become increasingly unpredictable.

Ball progression visualization showing arrows tracking movement from defensive third to attacking penalty area with increasing threat values represented by color intensity
Each pass or carry that moves the ball into a higher-threat zone increases the probability of scoring within the next five actions

Calculating Action Value with xT

For any action, the xT created is simply the difference in threat values:

Action Value Calculation Example
Action xT = xT(end zone) - xT(start zone)

Example:
A pass from zone with xT = 0.05 to zone with xT = 0.15
Action xT = 0.15 - 0.05 = 0.10

This pass increased the team's probability of scoring 
within five actions by 10 percentage points.

Why xT Matters: Understanding Advanced Football Statistics

The fundamental insight behind xT comes from basketball analytics, as articulated by researchers Cervone et al.: "Most advanced metrics remain based on simple tallies relating to the terminal states of possessions... This is akin to analyzing a chess match based only on the move that resulted in checkmate, leaving unexplored the possibility that the key move occurred several turns before."

Football has the same problem. Goals, assists, and even xG only capture terminal actions. They miss the progressive pass that broke a defensive line. The carry that dragged defenders out of position. The lateral ball that switched play to an overloaded flank.

According to PlaymakerAI's model, only 2% of events in football are shots. Over 76% of meaningful threat comes from passes and carries. xT addresses this imbalance by valuing the actions that create shooting opportunities rather than just the shots themselves.

What Expected Goals Misses: The xG Limitations

Expected Goals revolutionized football analytics by measuring shot quality. But it has blind spots:

  • The line-breaking pass that creates a shooting opportunity receives zero credit
  • The dribble that opens space is invisible to xG
  • The carry that progresses the ball from deep goes unrecorded

xT correlates weakly with xG (r-squared = 0.009) because it measures fundamentally different skills. A player can be excellent at creating xT without taking shots, and vice versa.

The Ozil-Kolasinac Example: xT vs Traditional Stats

Let's return to that Arsenal goal against Burnley with precise numbers:

  • Ozil's through ball: increased xT from 0.077 to 0.158 = 0.081 xT created (86% of total credit)
  • Kolasinac's cutback: increased xT from 0.158 to 0.171 = 0.013 xT created (14% of total credit)

The assist statistic gives Kolasinac full credit. xT reveals that Ozil's contribution was six times more valuable in terms of increasing scoring probability. This matters for player evaluation, contract negotiations, and scouting decisions.


Player action types comparison showing pass trajectories and dribble carries on a football pitch, split composition demonstrating different ways to create Expected Threat
Players create xT through different channels - De Bruyne through passing, Hazard through carrying, Messi through both

Real-World Examples: xT Soccer Analytics in Action

Jack Grealish vs Manchester United (2020/21)

Jack Grealish, then at Aston Villa, provided a masterclass in xT creation against Manchester United. He received the ball on the left flank (xT: 0.02), carried it into the penalty box (increasing xT by 0.013), then played a devastating pass to Bertrand Traore at the edge of the six-yard box (increasing xT by 0.26).

Total xT created: 0.30.

Grealish's combined carry and pass increased Aston Villa's probability of scoring by approximately 27 percentage points. The pass became an assist in the traditional statistics, but xT shows Grealish created the chance through both his driving run and the final ball.

The Full-Back Surprise: Jose Holebas

When Karun Singh published his Premier League xT rankings for 2017/18, one name surprised many observers. Jose Holebas, Watford's left-back, ranked third in cumulative xT created.

This illustrates xT's ability to identify undervalued players. Full-backs rarely score or assist in traditional statistics, but they often progress the ball consistently from deep positions. Holebas was creating danger at an elite level through his passing and carries, even if the final product was not always reflected in his goal contributions.

The Henderson Validation: Soccer Analytics Success Story

Perhaps the most compelling validation of possession-value metrics comes from Sarah Rudd's 2011 analysis. Her model identified Jordan Henderson as a top-25 Premier League player while rating Darren Bent poorly. At the time, this seemed absurd. Bent was a proven goalscorer, Henderson an unremarkable midfielder.

A decade later, Henderson had captained Liverpool to Premier League, Champions League, FA Cup, and League Cup victories. Bent's career had plateaued. The analytics community had been right all along.


Practical Applications: How xT Football Analytics is Used

Tactical Analysis with Expected Threat

Team Profiling: Per-team xT maps reveal where teams create danger. In Singh's original analysis, Manchester City and Tottenham had similar xT curve shapes in 2017/18, but City's magnitude was consistently higher. This identifies not just tactical similarity but quality differences.

Opponent Analysis: Aggregating xT by action start location shows where opponents generate danger. Combined with pass destination overlays, analysts can identify dangerous passages of play to defend.

Match Dominance: xT timelines during matches show which team is creating threat over time, regardless of whether shots occur. A team can dominate xT without registering shots if their buildup play is consistently progressing the ball into dangerous areas.

Player Evaluation Using xT Metrics

Identifying Undervalued Players: xT credits fullbacks, central midfielders, and other positions that rarely score or assist but consistently progress the ball. The Jose Holebas example demonstrates this clearly.

Pass vs Carry Profiles: xT can be split into contributions from passes and from carries:

  • High xT from passes: Kevin De Bruyne, Trent Alexander-Arnold - players who create through distribution
  • High xT from carries: Eden Hazard, Vinicius Jr, Raheem Sterling - players who create through dribbling
  • Elite at both: Lionel Messi, Neymar - rare talents who threaten through multiple channels

Decision-Making Analysis: Comparing a player's actual actions to optimal choices based on team xT profiles reveals decision-making quality. Did the player choose the highest-value pass available?

Scouting with Expected Threat Data

System Fit Assessment: Does a player's action profile match the team's xT preferences? A possession-based team might value different xT patterns than a counter-attacking side.

Young Talent Identification: xT surfaces players contributing to buildup who lack traditional goal/assist numbers. Ajax's academy graduates like Devyne Rensch and Ryan Gravenberch showed strong xT profiles before their moves to major European clubs.


Tactical analysis dashboard showing team heatmap profiles with danger creation zones and opponent defensive weaknesses overlaid on football pitch
Team xT maps reveal where danger is created, helping identify tactical matchups and undervalued players

Limitations of Expected Threat: What xT Doesn't Capture

No metric is perfect. xT has acknowledged limitations that analysts must understand.

Defensive Pressure Not Measured by xT

A pass into the box against a compact low-block is treated the same as one against a stretched defense. Basic xT ignores whether the player was under pressure when making the pass. This is a significant blind spot. The same action in different contexts has vastly different difficulty levels.

Opponent Positioning Blind Spots

Without player tracking data, xT cannot see where defenders are - only where the ball is. A zone might have high xT in general, but if it's crowded with defenders, the actual threat is lower than the model suggests.

Game Context Limitations

Scoreline, time remaining, and tactical situation aren't factored into basic xT. A team trailing 3-0 in the 85th minute might generate high xT as opponents sit deep, but this doesn't reflect genuine threat creation.

Unsuccessful Actions in xT Analysis

Most implementations only value successful passes and carries. A risky pass that's intercepted has zero value in basic xT, even if it was the right decision that didn't come off.

Counter-Attacks vs Patient Buildup

Basic xT values both equally if they end in the same position. A fast break against a disorganized defense should logically have higher value than a patient buildup, but xT's location-based approach misses this.

The Risk/Reward Problem in xT

xT doesn't account for the possibility of losing possession. A risky pass into the box has the same value as a safe one if both are completed, but the risky pass has a higher chance of being intercepted.

VAEP Framework Developers

While xT gained significant traction in the public sphere due to its simplicity, its location-based approach to valuing game states is not the most accurate. Soccer is a dynamic game: the threat lies in how the ball is moved, rather than where the ball is.

DTAI KU Leuven

The Evolution: From xT to VAEP, OBV, and Advanced Soccer Analytics

The limitations of basic xT have spawned more sophisticated frameworks:

VAEP (Valuing Actions by Estimating Probabilities)

Developed by KU Leuven's DTAI lab, VAEP uses machine learning with rich game state features including possession history. It includes both scoring probability AND conceding probability, addressing the risk/reward problem.

OBV (On-Ball Value)

StatsBomb's implementation builds on their xG model and incorporates defensive context from their 360 data (which shows player positions around the ball). OBV evaluates all actions and includes both Goals For and Goals Against components.

Possession Value (PV)

Opta's time-based approach measures the probability of scoring within the next 10 seconds, rather than the next few actions. This captures urgency and tempo differently.

g+ (Goals Added)

American Soccer Analysis's implementation for MLS adapts possession value concepts to the specific characteristics of American soccer.

These metrics share the same fundamental goal as xT but address specific limitations through more sophisticated modeling.


For Bettors: Using Expected Threat in Betting Analysis

Expected Threat offers several applications for football betting strategy.

Match Prediction with xT

Teams with high xT creation may be undervalued if their finishing has been unlucky. A team consistently creating dangerous positions but converting at below-average rates is likely to regress positively. xT provides a measure of underlying performance independent of finishing quality.

Player Props and xT Data

Midfielders with high xT from passes may be undervalued in assist markets. Their contribution to chance creation might not be reflected in actual assists due to teammate finishing, but the underlying process is strong.

Tactical Mismatches Identified by xT

Comparing a team's danger creation zones with an opponent's defensive weaknesses can identify betting edges. If Team A creates most of their xT from wide areas and Team B concedes heavily from crosses, the tactical matchup favors Team A.

Live Betting Using Expected Threat

xT timelines during matches show which team is creating threat over time. A team dominating xT but trailing on the scoreboard might be a live betting value.

Long-Term Player Valuation with xT

xT can identify players contributing at a high level who haven't yet translated that into traditional statistics. These players might be undervalued in various markets until their contribution becomes widely recognized.


The Future of Expected Threat and Possession Value Metrics

The next frontier for xT and related metrics involves several key developments.

Tracking Data Integration with xT

Combining xT with player tracking data will allow analysts to account for defensive positioning, value off-the-ball movement, and measure space creation rather than just ball progression.

Contextual xT and Dynamic Models

Dynamic Expected Threat (DxT) and similar models aim to incorporate defensive pressure, game state, and transition speed. This addresses the "context problem" that limits basic xT.

Risk/Reward Modeling in Football Analytics

Future models will increasingly balance scoring probability with conceding probability, particularly for high-risk actions like line-breaking passes.

Standardization of Soccer Analytics Metrics

As xT and related metrics become mainstream, standardization of calculation methods and benchmarks is emerging. Opta, StatsBomb, and major clubs all use possession value models, making comparison easier.


Conclusion: Expected Threat as a Foundational Football Analytics Metric

Expected Threat represents one of the most significant advances in football analytics since Expected Goals. By valuing buildup play rather than just terminal actions, xT captures contributions that traditional statistics miss entirely.

The metric isn't perfect. It ignores defensive context, treats all successful actions equally regardless of difficulty, and doesn't account for risk. But its simplicity is also its strength. As analytics expert Mark Thompson notes: "If you need some type of 'possession value' model as part of whatever work you're doing, just whip up xT. It'll get you 70% of the way you need to go, in 10% of the time."

For analysts, scouts, and bettors, xT provides a window into the "moves before checkmate" - the passes, carries, and dribbles that create scoring opportunities before anyone pulls the trigger. In a sport where margins are slim and information is power, understanding Expected Threat is no longer optional.

The assist tells you who passed. The goal tells you who scored. xT tells you who really created the chance.


Sources: Karun Singh's Expected Threat blog (2018), DTAI KU Leuven VAEP Framework, StatsBomb/Hudl Possession Value documentation, PlaymakerAI analytics platform, Soccermatics documentation, Get Goalside Analytics research.

Professional headshot of Marcus Worthington, Senior Football Editor & Analyst

Marcus Worthington

Senior Football Editor & Analyst

Marcus Worthington is an experienced sports analyst and editor with over 12 years in sports journalism. Specializing in football tactics, league analysis, and long-form feature writing, Marcus provides in-depth coverage of Premier League, La Liga, and European competitions. His expertise extends to live score commentary and match result analysis, where his detailed understanding of game dynamics helps readers understand the story behind the scores. Marcus is known for his tactical breakdowns and ability to identify emerging trends in team performances.