

Football

Moneyball Football: How Data Built Brentford, Brighton and Liverpool's Machine

Two professional gamblers and a Cambridge physicist changed how English football buys players. Here's how their models work, why they keep beating bigger budgets, and what every bettor can borrow from them.

Moneyball Football: How Data Built Brentford, Brighton and Liverpool's Machine
On this page

Two gamblers walk into a boardroom

In 2021 Brighton paid Independiente del Valle a reported £4.5m for a 19-year-old Ecuadorian midfielder most Premier League fans had never heard of. Two years later Moisés Caicedo joined Chelsea for a reported £115m, a British record at the time. That wasn't luck. That's Moneyball football: a club run like a betting syndicate.

Brighton's owner, Tony Bloom, made his fortune beating bookmakers. So did Brentford's owner, Matthew Benham, who used to work for him. Liverpool went another way and hired a physicist to run a research department, then leaned on his models through a spell that brought the Champions League, the Premier League and the Club World Cup to Anfield. All three clubs worked from the same belief. The market for footballers is mispriced, and numbers can find the gaps.

If that sounds familiar, it should. Spotting a wrong price is exactly what a value bettor does every Saturday. These clubs simply do it with 19-year-olds instead of 2.40 shots, and the way they built their machines has plenty to teach anyone with a betting account.

Moneyball explained, and why Benham hates the label

"The Moneyball label can be confusing because people think it is using any stats rather than trying to use them in a scientific way." — Matthew Benham, Brentford owner

Michael Lewis published Moneyball in June 2003. It told the story of Billy Beane's Oakland Athletics, who in 2002 took on the New York Yankees with a player salary budget of $44m against a Yankees payroll of more than $125m. Brad Pitt played Beane in the 2011 film, and that's how most football fans first came across the idea.

The insight was simple. Baseball's traditional numbers (batting average, stolen bases, runs batted in) were overrated. On-base percentage and slugging told you far more, and players who were good at those came cheap because the market didn't value them properly. Oakland reached the playoffs in 2002 and 2003 by buying what everyone else ignored, building on the work Bill James started in his Baseball Abstract, the root of what became sabermetrics.

Benham's gripe is fair. "Moneyball" has turned into lazy shorthand for "uses stats", and every club uses stats now. The edge comes from using them scientifically: build a model, test it, and back it when it disagrees with the room.

There's a sting in the tale, too. Lewis has acknowledged that the book's success may have hurt Oakland, because rivals copied the approach and the edge shrank. Anyone who's watched a profitable betting angle dry up once it went mainstream knows that feeling.

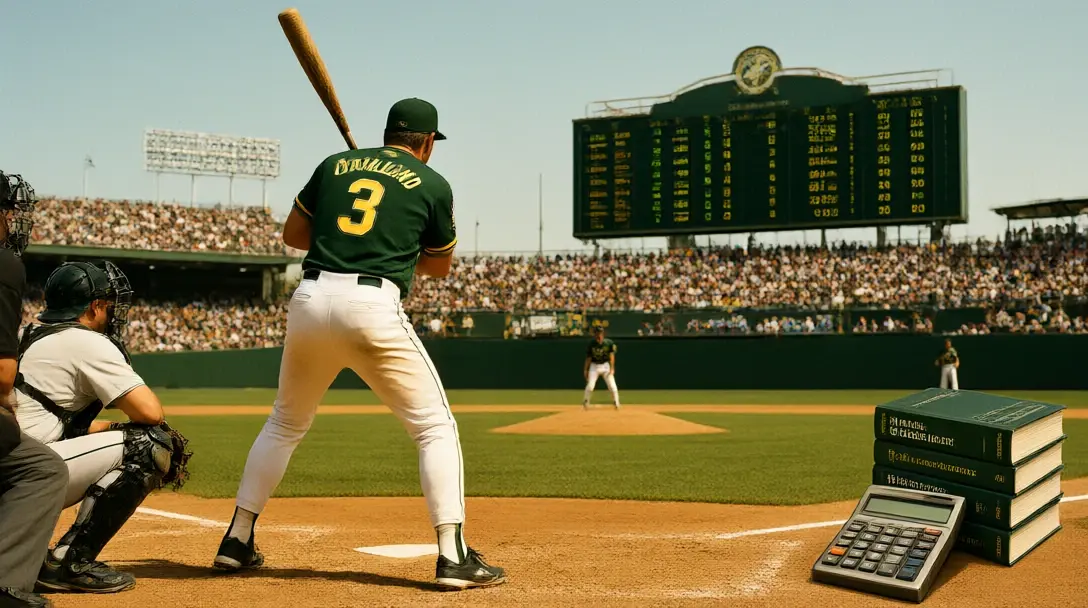
Oakland Athletics batter seen from behind at the plate in a 2002 ballpark, with baseball stats books in the corner
Moneyball: Oakland bought what the market ignored.

Matthew Benham: from Smartodds to Brentford

Benham read physics at Oxford, then spent around 12 years in the City as a hedge fund manager and derivatives trader. In 2001 Tony Bloom hired him at Premier Bet, where he made money in the Asian betting market with a statistical model built on the work of Lancaster University statisticians Mark Dixon and Stuart Coles. It predicted score probabilities more accurately than the bookmakers did.

The pair fell out, and in 2004 Benham founded Smartodds, a statistical research company selling modelling to professional gamblers, with Coles on board. He later bought into the Matchbook betting exchange as well.

Brentford had been his club since his first match in 1979. He started as an anonymous "mystery investor" in 2005, took over the club's loans for nearly £3m in 2007, and took full control in June 2012 with the Bees in the third tier.

Building the model club

From 2015/16 the plan was out in the open: use maths and statistics to find undervalued players, buy them cheap, develop them and sell at a profit. Brentford appointed two co-directors of football, Phil Giles, a former quant analyst at Smartodds, and Rasmus Ankersen, at a time when most English clubs had none. Manager Mark Warburton left in 2015, reportedly unhappy with the "mathematical modelling" and with losing his veto on signings.

It wasn't plain sailing. Marinus Dijkhuizen was sacked after nine games, and Benham called the appointment "a mistake". But Thomas Frank was promoted to head coach in 2018, the new stadium opened in August 2020, and in 2021 Brentford won the Championship play-off final to reach the top flight for the first time since 1946/47.

Benham ran the same playbook in Denmark. He took a majority stake in FC Midtjylland in July 2014 and used data for transfers, set pieces and fitness. They won their first league title in 2015.

The real stress test came in summer 2025. Frank left for Tottenham, set-piece coach Keith Andrews stepped up, and Bryan Mbeumo, Yoane Wissa and captain Christian Nørgaard were sold to Manchester United, Newcastle and Arsenal. Brentford finished ninth anyway.

Tony Bloom: the Lizard's algorithm at Brighton

Bloom was born in Brighton in 1970, took a maths degree at Manchester and, after spells at Ernst & Young and as an options trader, turned professional gambler. Poker players know him as "The Lizard", and his betting consultancy, Starlizard, carries the nickname. He's also won more than $3.8m in live poker tournaments, for good measure.

He became Brighton chairman in 2009, taking over from Dick Knight, and put £93m into the Falmer Stadium. Brighton won League One in 2010/11 and reached the Premier League in 2017 after 34 years out of the top flight.

Data first, scouts second

Bloom has his own software that filters the world transfer market, and he keeps the algorithm secret even from people inside the club. Brighton are a Starlizard client, buying in the data behind the recruitment programme. Names that pass a data-led "tick list", covering things like age and match minutes, go to the scouts, who report back in traffic lights: green for a great fit, amber for close, red for keep monitoring.

The hits are famous. Alongside Caicedo, Brighton reportedly signed Alexis Mac Allister from Argentinos Juniors for around £7m in 2019 and sold him to Liverpool for about £35m in 2023, picking up a World Cup winner's medal along the way. Marc Cucurella arrived from Getafe for £15m and left for Chelsea in a deal that could eventually earn Brighton a £48m profit.

The exodus that should have broken them

The best evidence for Bloom's machine isn't any one sale. Brighton finished ninth in 2021/22 on a then-record 51 points, and then the big clubs came shopping. Seventeen players left for around £350m combined and 30 staff walked out, including Graham Potter and his team to Chelsea and Dan Ashworth to Newcastle.

Most clubs would have fallen apart. Cucurella, Yves Bissouma, Leandro Trossard and Potter all went during 2022/23 or the summer before it, yet Brighton pulled Roberto De Zerbi off a coaching shortlist they already kept on file and finished sixth to reach Europe for the first time. When the process is the asset, losing the people who ran it hurts a lot less.

Brighton's curved-roof Amex Stadium below the South Downs, with a tablet showing a world map of transfer targets
Bloom's algorithm scans the world; Brighton buys before the price jumps.

Liverpool's research department under Ian Graham

Liverpool didn't have a gambler in charge, but they did have owners who believed in data. Fenway Sports Group had already shown at the Boston Red Sox that they took analysis seriously, and in April 2012 they headhunted Ian Graham, a Cambridge PhD in biological physics, as the club's first director of research. He stayed 11 years.

His main tool was a possession value model, which measures how much each player's touches change the team's chance of scoring. Early on it told an awkward truth. Joe Allen, a Brendan Rodgers favourite, played safe passes that looked tidy but added far less value than his manager thought. In the transfer committee era Rodgers could veto the data's picks, and Graham admits Liverpool sometimes ended up with "fifth- or sixth-choice players".

Firmino over Benteke

2015 was the clearest case. Graham "begged" the owners not to sign Christian Benteke on a £32.5m release clause, a target man for a team that didn't need one. The compromise was Roberto Firmino from Hoffenheim for £29m, a forward whose modest goal return hid an all-round contribution the numbers loved. Benteke managed 10 goals in 42 games and was sold after one season. Firmino scored 111 in 362.

Klopp changed who listened

Jürgen Klopp arrived in October 2015 and, in Graham's words, "the difference was Jurgen's open-mindedness". Same processes, same people, but now the manager was listening. Sadio Mané, a data favourite since his Salzburg days, came in 2016 when Klopp had first wanted Mario Götze. Joël Matip arrived on a free.

Then in 2017 the data and the scouts both backed Mohamed Salah from Roma for an initial £37m, despite his "Chelsea flop" tag and Klopp's preference for Julian Brandt. Graham said they "couldn't believe" Manchester City and Arsenal weren't bidding. You know the rest.

The football data revolution in dates

In little more than two decades this went from a fringe idea in a betting office to the way three Premier League clubs are run.

Year Who What happened
2001 Bloom and Benham Bloom hires Benham at Premier Bet
2003 Moneyball Michael Lewis's book is published in June
2004 Benham Founds Smartodds
2009 Bloom Becomes Brighton chairman
2012 Liverpool, Brentford Graham joins in April; Benham takes full control of the Bees in June
2014 Midtjylland Benham becomes majority shareholder in July
2017 Brighton, Liverpool Brighton reach the Premier League; Salah signs at Anfield
2021 Brentford Promoted to the top flight for the first time since 1946/47
2023 Brighton, Liverpool Caicedo and Mac Allister sold; Graham leaves Anfield
2025 Brentford Frank leaves for Tottenham; the model keeps rolling
Key dates in football's data revolution

How a football recruitment model actually works

Nobody outside these clubs knows the exact variables and weights, and Bloom keeps his from his own staff. The building blocks are well understood, though, and every one of them has a twin in betting.

One currency for every league

Numbers from Ecuador's top flight aren't worth the same as numbers from the Premier League. A good model puts every player on one scale, adjusting for league strength, age, position and role, so a midfielder in Ecuador gets judged as if he were already playing at the Amex. The simplest version looks like this:

projected xG per 90 = raw xG per 90 × league strength factor

Example: striker on 0.40 xG/90 in a league rated 0.70 of Premier League strength
         0.40 × 0.70 = 0.28 xG/90 projected in the Premier League

Filter with data, decide with eyes

Brighton's tick list narrows the field and humans make the call. Graham's golden rule is that the data must be allowed to disagree with the eye test, and you never bend the numbers to fit a player you already fancy: "A player you like will look good on one of the metrics even if they are a really bad player."

Buy before the peak, sell before the cliff

Analyst Michael Caley's work on ageing curves shows minutes played in Europe's big five leagues peak between 23 and 28, with most positions declining before 30. Wingers peak a year or two earlier and fade faster, while centre-backs get the longest peak, roughly 23 to 30. Graham's rule follows on naturally: buy players about to hit their peak, and make sure young signings actually play, at least 1,500 minutes a season.

Shrink the outliers, then price the player

One brilliant season on a small sample is mostly noise. Caley's baseline projection uses a regressed, weighted average of past performance, adjusted for context and age, which drags flukes back towards reality. Then comes value. Action-based metrics like possession value models score a player's contribution, and that gets weighed against fee and wages. Style fit matters as well. As Graham points out, a brilliant crosser is wasted if nobody's attacking the ball.

Recruitment room wall of player cards and ageing curves with green, amber and red cards, two analysts seen from behind
Filter with data, decide with eyes: the traffic-light shortlist.

Why data-driven football clubs punch above their weight

Brentford and Brighton compete with clubs whose resources dwarf theirs. Here's how that looks on paper.

2024/25 Brentford Brighton
League finish 10th 8th
Revenue £173.1m £222m
Wage bill £130.8m £165m
Profit on player sales £27.2m £57m (down from £110m)
Pre-tax result £20.5m loss £56m loss
Brentford and Brighton 2024/25 finances

How the small clubs keep winning, and the misses

How they do it isn't a secret. Buy young in markets the big clubs neglect, sell when the fee beats the model's valuation, and build a structure that survives when managers and directors leave. Set pieces keep cropping up too: Midtjylland used data to sharpen theirs, and Brentford handed the top job to their set-piece coach.

The misses

None of this is magic. Dijkhuizen lasted nine games. Graham's department backed Mario Balotelli, who managed four goals in 28 appearances. Our list of transfer flops and bargains shows even the smartest buyers get it wrong.

The money cuts both ways, too. Brighton swung from a £75m profit to a £56m loss in 2024/25 largely because player sales dropped, and rising costs are squeezing Brentford's sustainable model. A data edge is an edge. It isn't a guarantee.

The short version

Brentford, Brighton and Liverpool treated the transfer market like a betting market: build a model, find the mispriced players and back the numbers when they disagree with the room. The edge lives in the process rather than any one signing, which is why Brighton and Brentford kept rolling after losing stars and managers. Price versus value, chances over scorelines and staking to survive the misses all travel straight to your betting account.

Five lessons bettors can steal from data-led clubs

"You always need a sucker in the market. If everyone is using data brilliantly, I am out of a job, aren't I?" — Ian Graham, former Liverpool director of research

Graham could have been talking about betting, and in a way he was. The men who built Brentford and Brighton learned their trade beating bookmakers, so it's no surprise the lessons travel straight back.

Price versus value

Clubs buy when the fee is below their model's valuation. You should only back a selection when the odds are bigger than the fair price. Same discipline, different market.

Process over outcome

Results are noisy; chance quality is the signal. A 1-0 win can hide an xG of 0.4 against 2.5, and the Dixon-Coles style models Benham and Bloom started with were all about the probabilities behind the score rather than the score itself. Tools like expected threat take that further.

Don't make the stats fit the story

Graham's warning about players you already like is confirmation bias in a tracksuit. Go hunting for a number to support the bet you wanted anyway and you'll always find one.

Edges decay

Oakland lost ground once everyone had read Moneyball. Your favourite angle will fade once the market catches on, so keep testing it and be ready to move on.

Bankroll for the misses

Balotelli happens. Even a sound model throws up bad runs, so stake in a way that lets you ride them out.

Our betting angles

  • Don't write off a data club after a summer sale. Brighton lost Potter, Cucurella, Bissouma and Trossard across 2022/23 and finished sixth; Brentford lost their manager and three key men in 2025 and finished ninth. The headlines overrate the exits.
  • Back the structure, not the manager. When a data-led club changes head coach the recruitment machine keeps running, so we'd be slow to oppose them just because a manager has gone.
  • Trust chances over scorelines. A team winning ugly on poor xG is one to oppose; a side losing narrowly on strong numbers is one to follow.
  • Respect the set-piece specialists. Clubs that treat dead balls as a science are worth a look in set-piece-driven markets such as corners and headed goals.
  • Build your own baseline. Benham and Bloom started with a score-probability model, and a simple one is well within reach: our guide to building a betting model shows you how.
  • Be the buyer, not the sucker. Only bet when your price beats the market's, and walk away when it doesn't.

Treat every bet as one entry in a long sample, stake the same sensible amount each time, and let the edge do the work.

Topics

Professional headshot of Caleb Harrington, Senior Football & Betting Analyst

About the author

Caleb Harrington

Senior Football & Betting Analyst

Caleb Harrington is an experienced sports analyst and writer with over 8 years of expertise in football betting markets and tennis predictions. A graduate of Sports Journalism, Caleb combines deep statistical knowledge with an engaging writing style to make complex betting concepts accessible to all readers. He's particularly known for his data-driven approach to Premier League analysis and his insightful coverage of major tennis tournaments. When he's not analyzing odds or writing match previews, Caleb enjoys exploring emerging trends in sports betting technology and strategy.